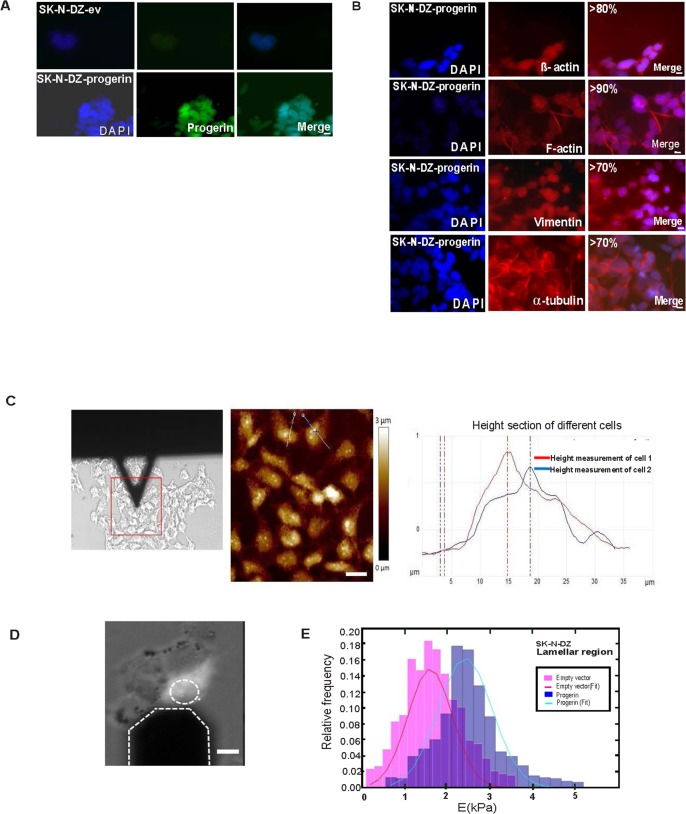
Fig 7. Progerin introduction in SK-N-DZ cells induces changes in cytoskeletal components and mechanical properties.
(A) Immunofluorescence staining showing Progerin. (B) Changes in β-actin, F-actin, vimentin filaments, and α-tubulin after Progerin introduction. Progerin is shown in green; β-actin, F-actin, vimentin, and α-tubulin are shown in red; and DNA is stained in blue (DAPI). Scale bar, 10μm. (C) Representative AFM images of height measurement in SK-N-DZ-ev cells. In red and blue height profile across lines in different cells from height AFM image are shown Scale bar, 10μm (D)The AFM tip is positioned directly above the lamellar region. Scale bar 10μm (E) Normalized histogram of the data obtained from both groups for the lamellar region. Each histogram was fitted to a Gaussian curve to obtain the mean value and the standard deviation of Young’s Modulus. Three independent experiments (n1 = 3) with 3 replicates per experiment (n2 = 9) were performed. A Student’s t-test confirmed that the difference was significant (**p<0.01).

