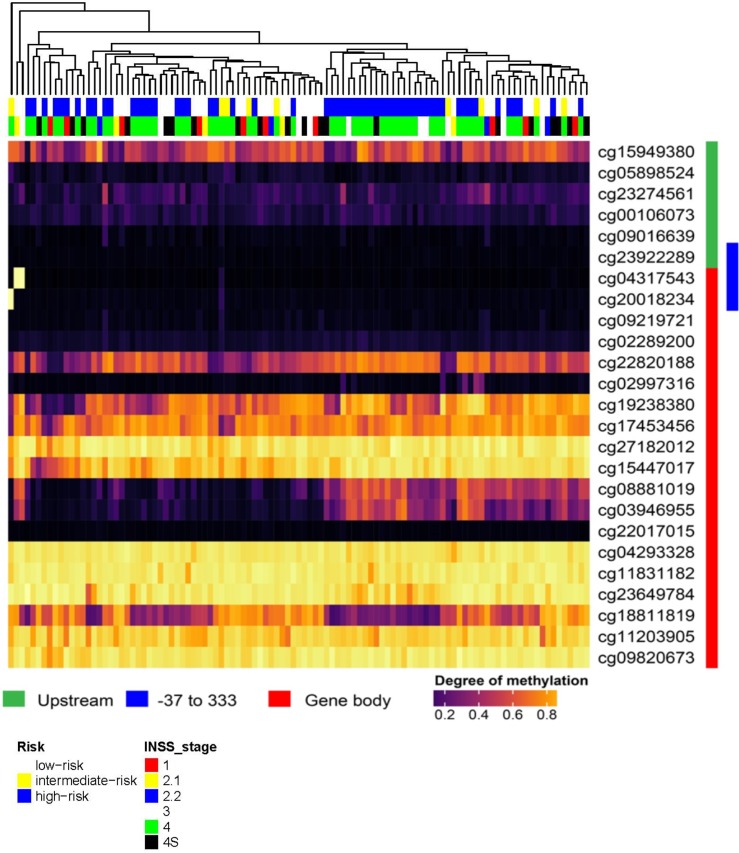
Fig 8. Methylation analysis of the Lamin A/C gene in neuroblastoma patients.
Degree of methylation in neuroblastoma tumours at Lamin A/C locus is visualized as colour scale from black(very low methylation) to yellow (fully methylated) in a heatmap, where rows represent CpGs represented on the array (with array probe ID) and columns represent patients. As indicated by coloured bars on the right (green/red), the heatmap illustrates the genomic locations of the Lamin A/C gene from top to bottom, while array locations marked in green represent positions upstream of the TSS, and red marked locations represent the coding sequence In addition, the promoter region -37 to +333 is highlighted in blue. The column tree vizualizes the hierachical clustering on patients. On top of the heatmap clinical parameters: risk (white = low risk, yellow = intermediate risk, blue = high risk) and international neuroblastoma staging system (Inns) stage are given (see colour legend for 6 stages).

