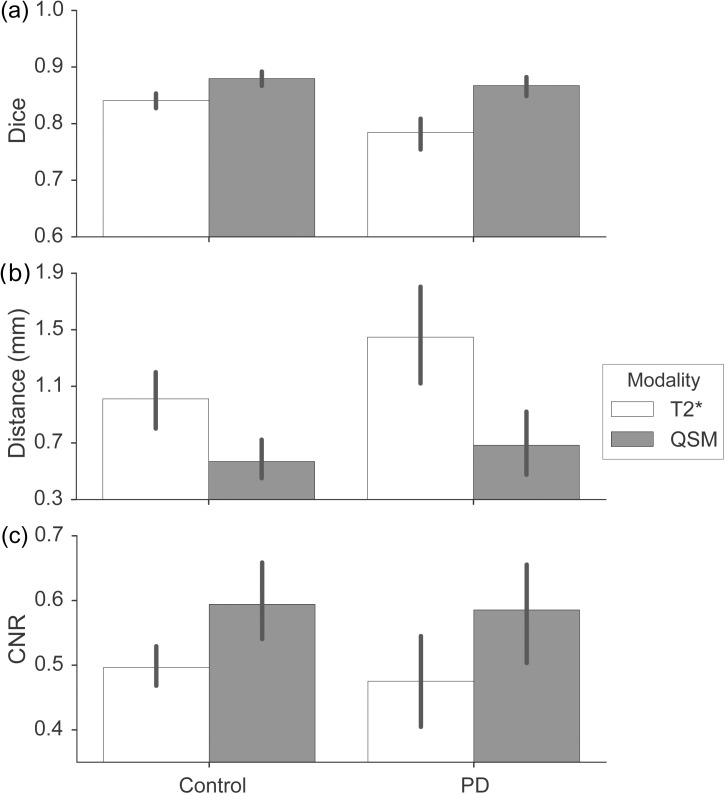
Fig 2. Quantitative results.
A) Mean dice-coefficients. PD participants are compared to healthy controls. Error bars indicate 95% bootstrapped confidence intervals. Note the significant increase in Dice-coefficient in QSM contrasts. B) Mean distances between the center of mass. Error bars indicate 95% bootstrapped confidence interval. Note the smaller distances in the QSM corresponding to higher agreement between raters. C) Average contrast-to-noise ratios (CNRs). Error bars indicate 95% bootstrapped confidence interval. Note that higher CNR-values in QSM contrasts reflect improved visibility.

