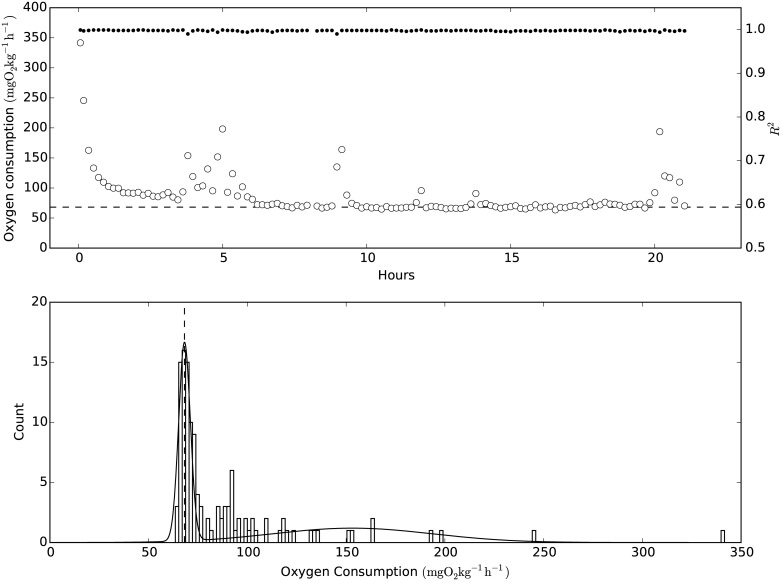
Fig 5. An example of the oxygen consumption rate during an experiment and the determination of standard metabolic rate.
Upper panel: Open circles represent oxygen consumption rate (ṀO2) and solid circles represent the corresponding R2. The values were recorded at 25 PSU and 18°C. Lower panel: a histogram of all ṀO2 values with an R2 above 0.95, fitted to a double Gaussian distribution (solid line). The standard metabolic rate is shown in both panels by punctuated lines, and was determined as the lowest mean of the two Gaussian distributions.

