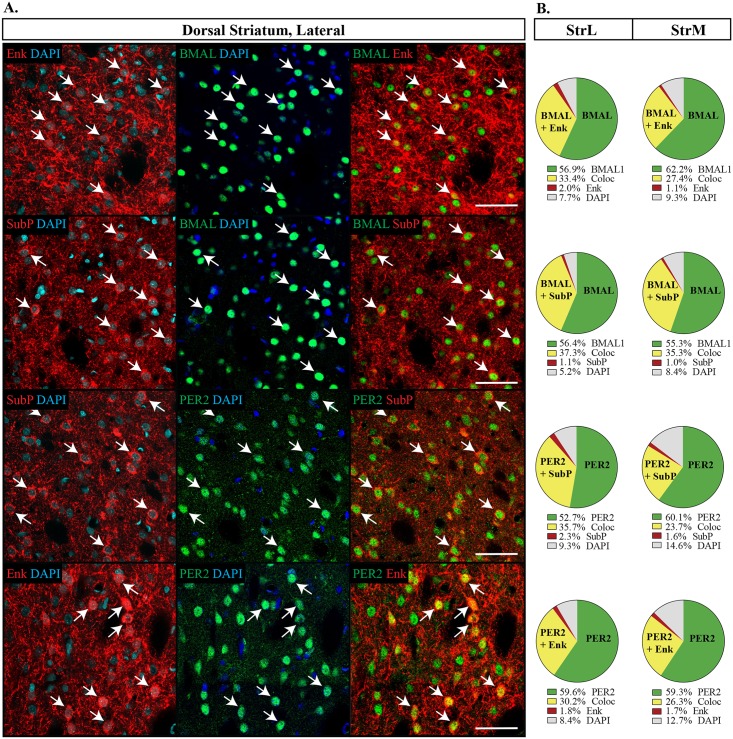
Fig 2. Distribution of proteins in the dorsal striatum.
(A) Each combination of antibodies analyzed are shown, sampled from the lateral dorsal striatum (StrL). Enkephalin (Enk) or Substance P (SubP) in red, DAPI in blue and PER2 or BMAL1 (BMAL) in green. Arrows point to the same cell within each row and indicate that clock genes are expressed with both Enk and SupP. Scale bar: 50 μm. (B) Pie charts representing the proportion of cells labelled with each double labeling combination in the StrL or medial dorsal striatum (StrM). The proportion of co-expression of clock genes with BMAL1 or PER2 and SubP or Enk is similar across each possible combination. Green: PER2 or BMAL with DAPI only; Yellow: PER2 or BMAL1 with Enk or SubP (Coloc), representing cells with co-expression; Red: Enk or SubP with DAPI only; Grey: cells identified with DAPI but not labelled with PER2, BMAL, Enk or SubP.

