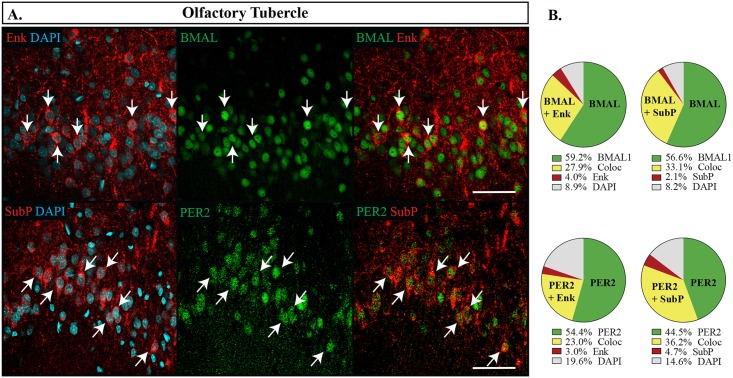
Fig 4. Distribution of proteins in the olfactory tubercle.
(A) Localization of proteins in the olfactory tubercle. Enkephalin (Enk) or Substance P (SubP) are shown in red, DAPI in blue and PER2 or BMAL1 (BMAL) in green. Arrows point to cells labelled with both proteins and indicate the same cell across the row. Scale bar: 50 μm. (B) Pie charts representing the proportion of each labelled cell combination. Green: PER2 or BMAL1 with DAPI only, Yellow: co-expression of PER2 or BMAL1 with Enk or SubP (Coloc), Red: Enk or SubP with DAPI only, Grey: cells identified with DAPI but not labelled with PER2, BMAL1, Enk or SubP.

