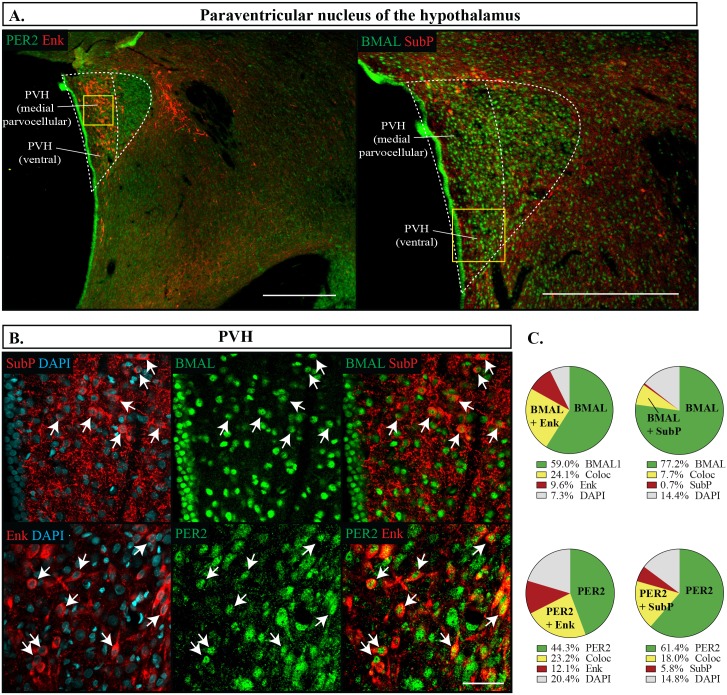
Fig 10. Distribution of proteins in the paraventricular nucleus.
(A) Outlines of regions imaged in the paraventricular nucleus of the hypothalamus (PVH) are shown to the left of the dashed white line. Scale bar: 500 μm. The yellow box represents the region from where the below images were sampled from. (B) Localization of proteins in the PVH showing PER2 or BMAL1 in green, Enk or SubP in red, and DAPI in blue. Arrows point to cells labelled with both proteins and indicate the same cell across the row. Scale bar: 50 μm. (C) Pie charts representing the proportion of each labelled cell combination in the PVH. Green: PER2 or BMAL1 with DAPI only, Yellow: PER2 or BMAL1 co-expressing Enk or SubP (Coloc), Red: Enk or SubP with DAPI only, Grey: the remaining cells identified with DAPI but not labelled with PER2, BMAL1, Enk or SubP.

