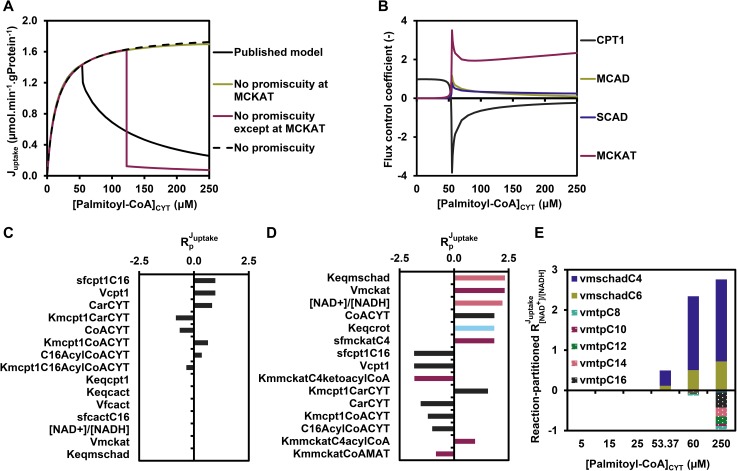
Fig 3. The role of the short-chain branch.
(A) Steady-state flux versus [palmitoyl-CoA]CYT in the published model (black line), a model without any enzymatic promiscuity (black dashed line, reproducing results from [8] as a reference), a model without promiscuity of MCKAT (green line), and finally a model with only promiscuity of MCKAT, but not of any of the other enzymes (purple line). (B) The flux control coefficients in the original model as a function of [palmitoyl-CoA]CYT. Only enzymes with a substantial contribution are included; for a complete set of flux control coefficients, see figure A in S2 Fig. (C-D) Top 15 flux response coefficients with the highest absolute values at 25 μM (C) and 60 μM (D) of [palmitoyl-CoA]CYT. The parameters p for which the flux response coefficient was calculated is indicated on the Y-axis. Dark grey bars represent CPT1-related parameters, pink bars represent M/SCHAD-related parameters, purple bars represent MCKAT-related parameters and the light blue bar represents a crotonase-related parameter. (E) Flux response coefficient of [NAD+]/[NADH] () partitioned in contributions of individual NAD+-dependent reactions at 5 palmitoyl-CoA concentrations according to . (cf. Eq 4). The contributions of M/SCHAD reactions C8-C16 to were negligible and therefore not shown in the legend.

