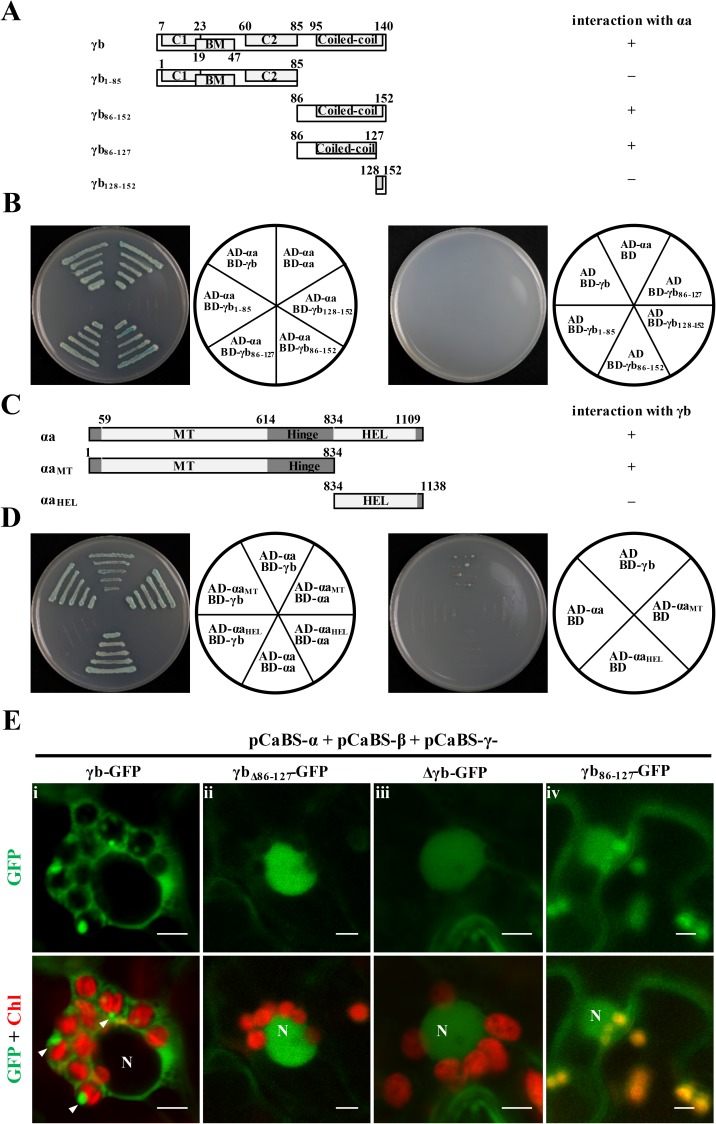
Fig 4. Yeast two-hybrid mapping of γb and αa protein interacting regions.
Panel A: Schematic representation of γb truncation or deletion mutants used for Y2H assays. Interactions with αa are indicated on the right. Panel B: Y2H mapping of regions within γb that interacted with αa. Various γb mutants were cloned into the bait vector pGBKT7 and tested for interactions with the αa protein expressed from the prey vector pGADT7. The divided circles illustrate different vector combinations. Panel C: Schematic representation and interactions (right side) of αa truncation or deletion mutants tested for interactions with γb in Y2H assays. Panel D: Y2H mapping of αa regions that interact with γb. In Panels A and C, “+” indicates γb or αa regions that are involved in γb-αa interaction, whereas “–” indicates regions that are not involved in γb-αa interactions. In Panels B and D, yeast cells were co-transformed with the prey and bait plasmids as depicted in the diagrams to the right of each panel, and incubated on yeast synthetic drop-out media (SD-Ade-His-Leu-Trp) supplemented with X-α-Gal. Combinations of γb or αa derived bait vectors with the empty prey vector pGADT7, or the empty bait vector pGBKT7 with the αa or γb derived prey vectors, served as negative controls. Panel E: Subcellular localization of γb deletion mutants at 3 dpi. Agrobacteria containing pCaBS-α, pCaBS-β and various pCaBS-γ derivatives shown in S2C Fig were agroinfiltrated into N. benthamiana leaves, followed by confocal microscopy analyses. Different pCaBS-γ derivatives used for agroinfiltration are indicated (i-iv). Chlorophyll autofluorescence (Chl) is shown in red. Nuclei are identified by N. White arrowheads indicate fluorescent aggregates associated with the chloroplasts. Scale bar, 5 μm.

