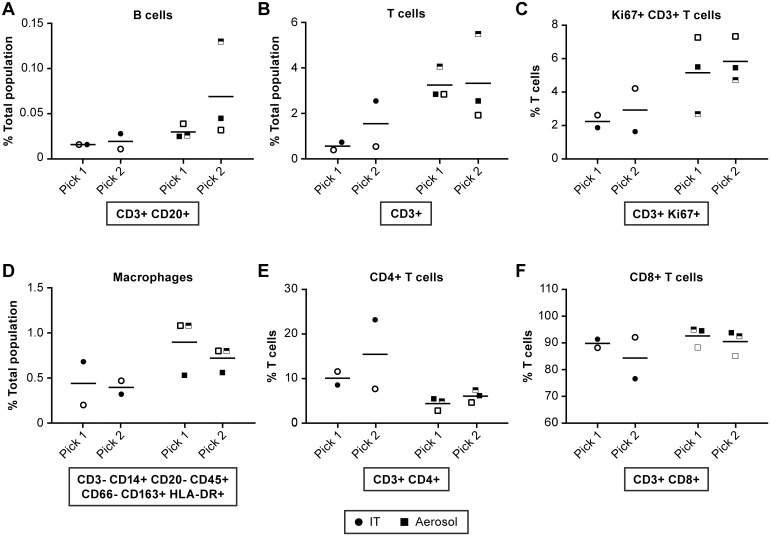
Fig 10. Evaluation of immune cell populations in the brain collected at necropsy.
Comparisons of immune cell populations in two samples collected from the cerebral cortex at necropsy from animals infected by IT (●) or aerosol (■) inoculation. Markers are consistent for individual animals. IT inoculated: 8204 (●), 8213 (half-filled ○) and 8181 (○); Aerosol inoculated: 8210 (□), 8095 (half-filled □) and 8206 (■). Represented are data for (A) B cells, (B) T cells, (C) Ki67+ T cells, (D) Macrophages, (E) CD4+ T cells and (F) CD8+ T cells. These data suggest that T cells infiltrated into the brain of aerosol-infected animals and that a higher proportion of these cells are activated. There were also an increased number of macrophages in the brain of two of the animals in the aerosol group. Statistical analyses were not performed due to limited group size.

