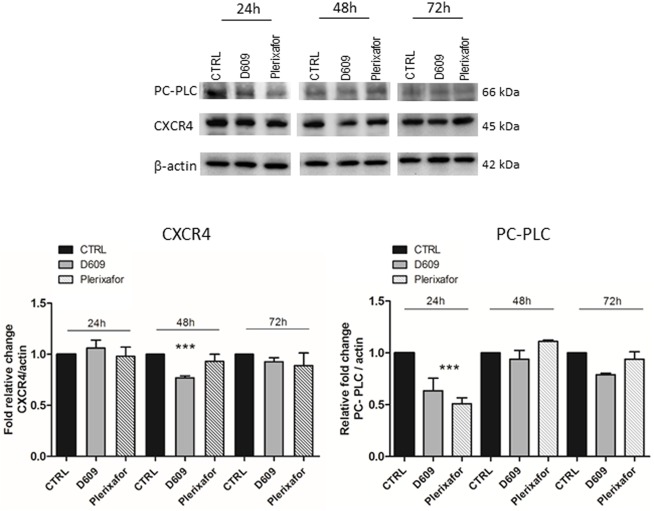
Fig 2. Analysis of total CXCR4 and PC-PLC protein contents in U87MG cell lysates.
Representative WB of CXCR4 and PC-PLC detection in U87MG cells processed after 24h, 48h and 72h of treatment with either D609 or Plerixafor. β-actin was used as loading control. The histograms represent the mean value ± SD of relative fold change of CXCR4 (on the left) and PC-PLC (on the right) optical density (OD) normalized to β-actin, obtained by densitometric analyses of WB bands (Image J software). CTRL values normalized to 1 at each time point; n = 3 independent experiments. Statistical analyses were performed with one-way ANOVA *** P = 0.0008 (CXCR4 expression), ***P = 0.0008 (PC-PLC expression).

