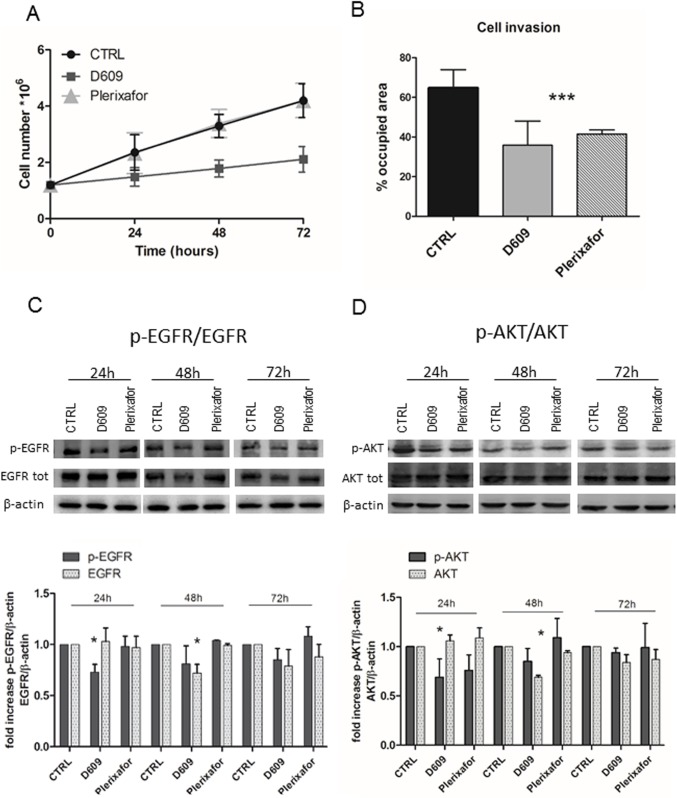
Fig 3. Effects of D609 and Plerixafor on cell proliferation, invasion and cell signaling.
A) U87MG cell proliferation after 24h, 48h, 72h of treatments with D609 or Plerixafor evaluated by cell counting using the Trypan blue excluding assay. Curves represent mean values ± SD of U87MG cell counts at different time-points (n = eight independent experiments). ● CTRL; ■ (dark grey square) D6099; and ▲ (light grey triangle) Plerixafor. Statistical analyses were performed with two-tailed unpaired t Student’s test. CTRL versus D609: 24h * P = 0.05; 48h *** P = 0.0001; 72h ** P = 0.0005. B) U87MG cell invasion evaluated by transwell chamber assay using Matrigel, in response to D609 or Plerixafor 24h treatment. The histograms represent the percentage of the area occupied by U87MG cells. CTRL values = 100%. Mean values ± SD (n = 6). Statistical analyses were performed with one-way ANOVA. ***P = 0.0001. C) Representative WB of p-EGFR and total EGFR expression in U87MG cells either untreated (CTRL), or treated with D609 or with Plerixafor for 24h, 48h and 72h. β-actin was used as loading control. The histograms represent the mean values of relative fold changes of p-EGFR and EGFR optical density normalized to β-actin, obtained with densitometric analyses of the WB protein bands (Image J software). CTRL values = 1. Means ± SD of n = 3 independent experiments. Statistical analyses were performed with one-way ANOVA * P = 0.0333 (p-EGFR); * P = 0.0141 (EGFR). D) Representative WB of p-AKT and AKT expression in U87MG control cells (CTRL) and in cells treated with either D609 or Plerixafor for 24h, 48h and 72h. β-actin was used as loading control. Histogram represents the mean of relative fold change of p-AKT and AKT optical density normalized to β-actin, obtained with densitometric analyses of WB protein bands (Image J software). CTRL values = 1. Means ± SD of n = 3 independent experiments. Statistical analyses were performed with one-way ANOVA * P = 0.0230 (p-AKT); * P = 0.0165 (AKT).

