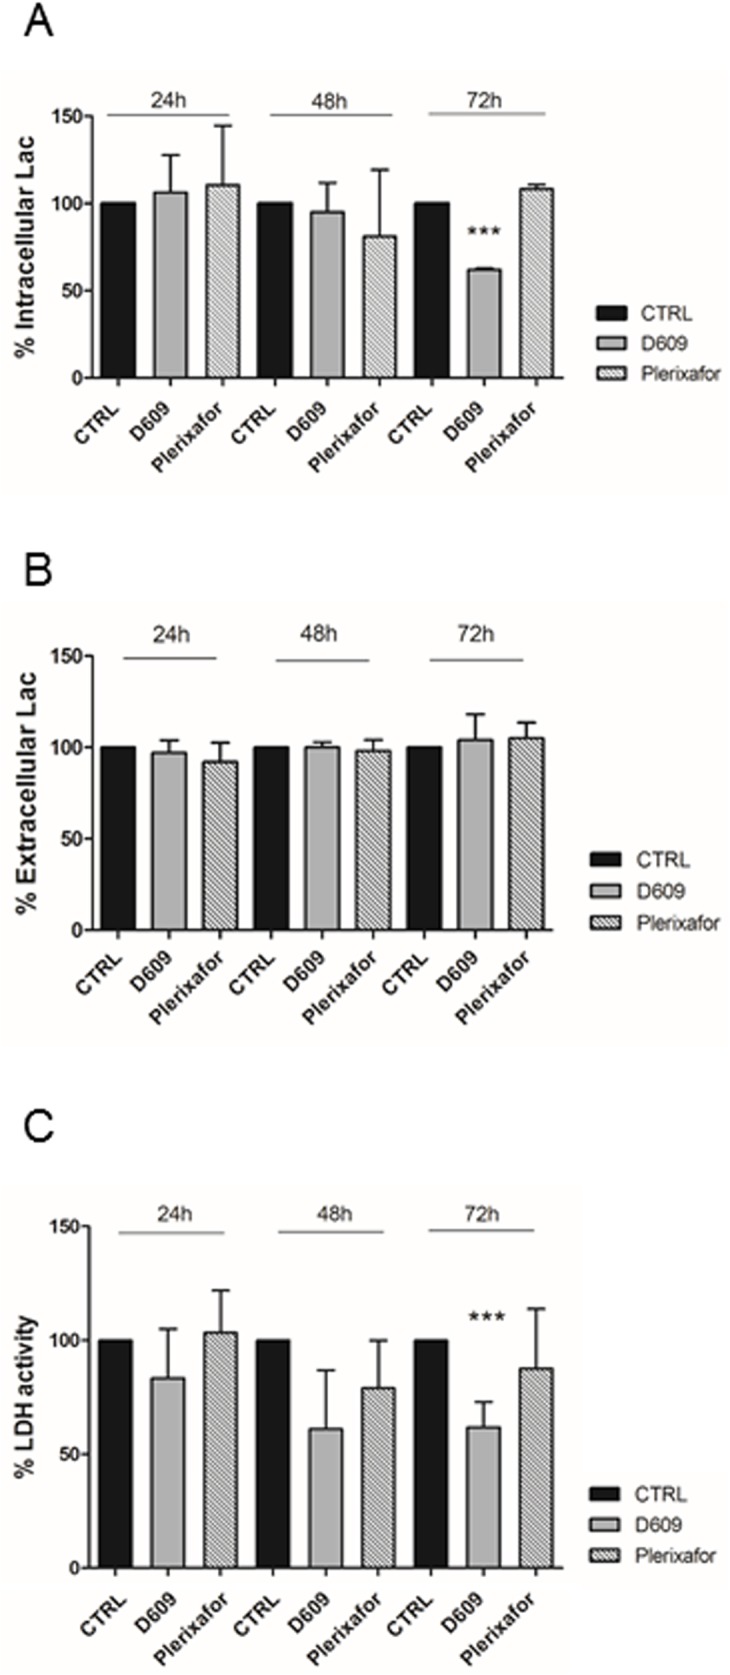
Fig 5. Lactate and LDH measurements in U87MG cells.

A) Histogram represents mean values of percentage of intracellular Lac concentration in U87MG obtained colorimetric assay after 24h, 48h, 72h of treatments. Mean value ± SD of n = 3 independent experiments. Statistical analyses were performed using one-way ANOVA. ***P = 0.0003. B) Histogram represents mean ± SD of percentage values (n = 3 independent experiments) of LDH intracellular activity measured by colorimetric assay at different treatment time-points (24h, 48h, 72h). Statistical analyses were performed using one-way ANOVA. ***P = 0.0006; unpaired two-tailed Student-t test CTRL 72h VS D609 72h P = 0.004. C) Histogram represents mean ± SD of percentage values of Lac extracellular concentration measured by a colorimetric assay on U87MG-conditioned medium in response to treatments (24h-48h-72h) (n = 3 independent experiments). All values were normalized for μg of proteins. CTRL values = 100%.
