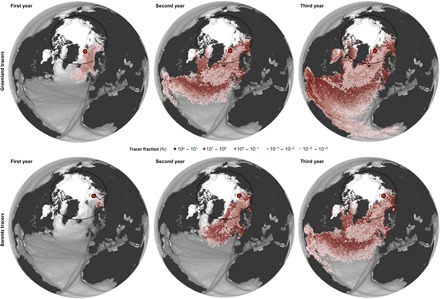
Fig. 3. Oceanic pathway of the plastic accumulations in the Greenland Sea (upper maps) and the Barents Sea (lower maps) obtained by simulations backward in time.

Tracers were released at the locations of maximal plastic concentrations in Greenland and Barents seas (red circles), and their surface transport was modeled for the previous years (1 to 3 years). Units are expressed as percentage of tracers in each pixel. The background image for the ocean shows the vessel density in gray scale. Note the close agreement between the modeled plastic pathway and the THC route described in the literature (Fig. 1). Likewise, the tracers released in the Northeastern Barents Sea were placed 1 year before into a zone where high plastic concentrations were also measured.
