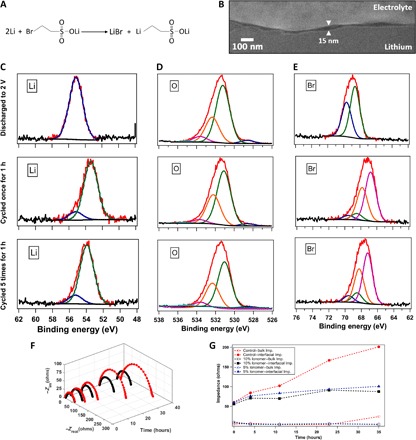
Fig. 1. Artificial SEI concept and experimental verification of its proposed operating mechanism.

(A) Schematic for the reaction of lithium 2-bromoethanesulfonate with lithium metal forming LiBr and lithium-based organometallic. (B) SEM image of the interfacial layer between an intact electrolyte and a lithium electrode, revealed in a cross section produced by cryo-FIB milling. (C) Lithium 1s peak obtained from XPS of the lithium metal anode of a Li-O2 battery with the electrolyte ionomer [10% (by weight)] in 1 M LiNO3-DMA. (D) Oxygen 1s peak of the lithium anode. (E) Bromine 3d peak of the lithium anode. In (C) to (E), the first row shows the postmortem analysis after discharging until 2 V, the second row shows the result after cycling once with each half-cycle 5 hours long, and the third row shows the result after cycling five times with each half-cycle 1 hour long. (F) Three-dimensional diagram of Nyquist plots obtained by impedance measurements at different intervals of time using symmetric lithium cells, in which -Zim is the imaginary component of the impedance and -Zreal is the real component of the impedance. (G) Comparison of interfacial and bulk impedance values for ionomer-based and control electrolytes as a function of time. In (F) and (G), the red symbols denote results with the control electrolyte (1 M LiNO3-DMA), whereas the black and blue symbols represent batteries with 10 and 5% (by weight) ionomer additive, respectively, with the same electrolyte.
