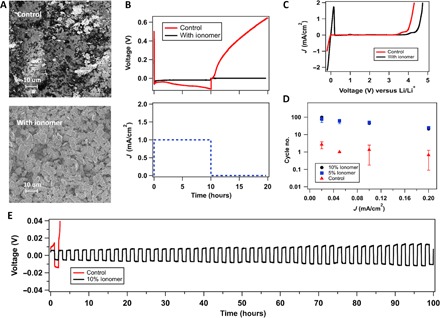
Fig. 2. Stabilizing the lithium-electrolyte interface.

(A) SEM images of stainless steel (SS) electrode after depositing lithium (10 mAh/cm2) in a Li||SS cell with and without the ionomer additive using the same electrolyte of 1 M LiNO3-DMA. (B) Voltage profile of the Li||SS cell plotted over time. In this experiment, Li+ ions were deposited onto the stainless steel side at a current density of 1 mA/cm2 for 10 hours, after which the cell was kept at rest for an additional 10 hours, as shown in the current-versus-time curve. In the voltage-versus-time graph, the red line represents the profile of the control electrolyte (1 M LiNO3-DMA), whereas the black line is for the same electrolyte enriched with 10% (by weight) ionomer additive. The dashed blue line in the current-versus-time graph is the applied current for both cases. (C) Linear scan voltammetry showing current as a function of voltage versus Li/Li+, with Li as both working and reference electrode and SS being the counter electrode. (D) In a Li||SS cell, lithium with 10-mAh/cm2 capacity is deposited onto SS, and the battery was charged and discharged consecutively at various current densities. The cycle number associated with the divergence of voltage is plotted against the respective current densities. (E) Voltage profile for the strip-and-plate experiment under the abovementioned condition using a current density of 0.05 mA/cm2. In all figures, red indicates the control electrolyte (1 M LiNO3-DMA) and black represents the addition of 10% (by weight) ionomer additive, whereas blue denotes 5% (by weight) addition.
