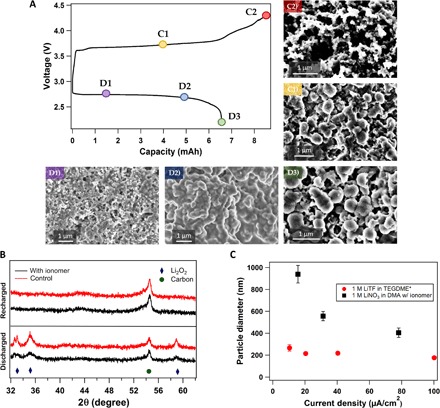
Fig. 3. Characterization and electrochemical analysis of oxygen cathode.

(A) Full charge-discharge cycle of a Li||O2 cell using ionomer-enriched 1 M LiNO3-DMA electrolyte operated at a current density of 31.25 μA/cm2. The different points on the voltage profile indicate various stages at which the same-type cells were stopped for ex situ analysis. The images below the voltage profile show the surface of a carbon cathode at the D1, D2, and D3 discharge phases. The size of the Li2O2 is seen to be increasing over the course of discharge. C1 and C2 show the stages of recharge; it is seen in C1 that the cathode is absent of Li2O2 particles. (B) XRD analysis showing various characteristic peaks for a fully discharged and a recharged Li||O2 battery. Here, diamonds denote Li2O2 peak and circles represent carbon. The red lines refer to the control electrolyte (1 M LiNO3-DMA), whereas black lines show the result for the same electrolyte with the ionomer additive. (C) The diameter of Li2O2 particles obtained by fully discharging a Li||O2 cell is plotted as a function of current density. Here, black indicates the electrolyte (1 M LiNO3-DMA) with the ionomer additive, whereas red represents data from Lau and Archer’s paper that used the electrolyte 1 M LiTF in TEGDME. *From Lau and Archer (10).
