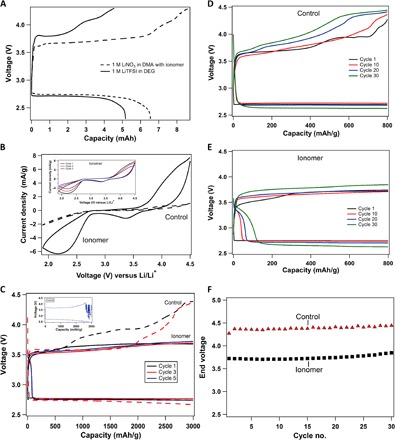
Fig. 4. Galvanostatic cycling performance of lithium-oxygen electrochemical cell.

(A) Voltage profile for batteries fully discharged and recharged with 1 M LiNO3-DMA + ionomer electrolyte (shown with a solid black line) and a low–donor number electrolyte, 1 M LiTFSI-diglyme (shown with a dashed black line), at a current density of 31.25 μA/cm2. (B) Comparison of cycling voltammetry results for the control electrolyte (1 M LiNO3-DMA; shown with dashed lines) and the same electrolyte with the ionomer additive (shown with solid lines). The inset shows three cycles of cyclic voltammetry for the ionomer case. (C) Voltage profile of the Li||O2 battery with a cutoff capacity of 3000 mAh/g and a current density of 0.04 mA/cm2. The solid lines indicate ionomer-based electrolytes, whereas the control is shown with dashed lines. The inset shows the noisy profile of the fifth cycle with the control electrolyte. (D) Voltage profile with a capacity cutoff of 800 mAh/g and a current density of 0.08 mA/cm2 for a Li||O2 cell using the control electrolyte (1 M LiNO3-DMA). (E) Voltage-versus-capacity curve with the same cutoff of 800 mAh/g using the ionomer additive in the electrolyte. (F) End voltage of charging cycle for the control and the ionomer-added electrolyte is plotted as function of cycle number.
