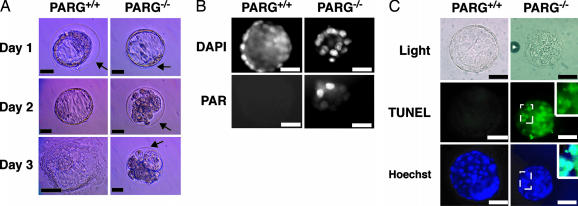
Fig. 2.
Impaired ability to hatch, increased levels of PAR, and cell death by apoptosis in PARG–/– embryos. (A) Microscopic analysis of E3.5 PARG+/+ and PARG–/– embryos up to 72 h in culture. Arrows indicate an intact zona pellucida. (B) Fluorescence microscopic analysis of PAR levels in E3.5 embryos 24 h after culture. Embryos displaying the hatched/unhatched phenotype were analyzed for PAR levels. DAPI, 4′,6-diamidino-2-phenylindole. (C) Fluorescent immunostaining for TUNEL (Middle) and Hoechst 33342 (Bottom) in E3.5 embryos displaying the hatched/unhatched phenotype 24 h after culture. (Middle Right and Bottom Right Insets) Magnification of the area in the embryo indicated by the dotted box. The Bottom Right Inset represents the overlay of the TUNEL and Hoechst stained area. (Scale bars: 25 μm.) All photographs are representative of several analyzed blastocysts (Table 2).

