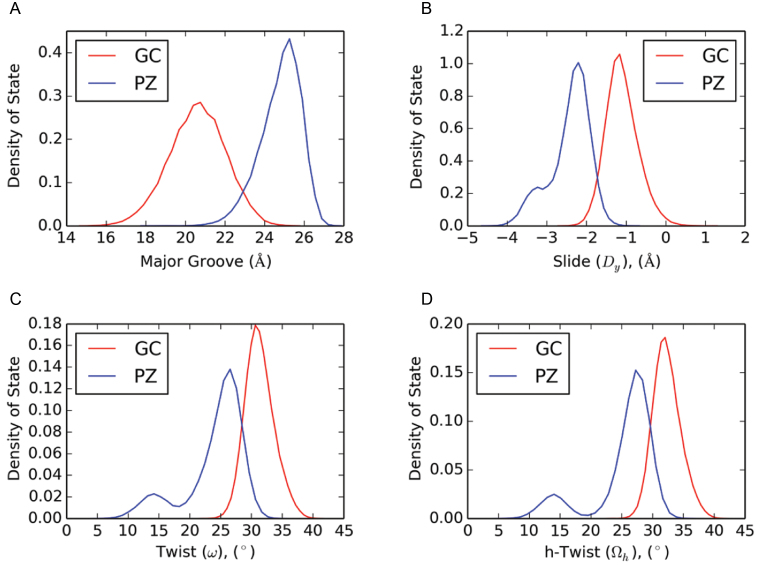
Figure 2.
Representative histograms for selected helical parameters (A: major groove width; B: slide; C: twist; D: h-twist) for the PZ-containing (blue) and the control (red) oligonucleotide in the MD simulations. Plots for all other parameters are provided elsewhere (Supplementary Figure S1). The histograms show distributions over GC/GC and GG/CC dinucleotide steps, and over PZ/PZ and PP/ZZ dinucleotide steps, whereas averages are given for only GC/GC and PZ/PZ steps in Table 2. Density of state is defined as the number of structures for which the parameter falls in a defined range divided by the total number of structures sampled in each trajectory.

