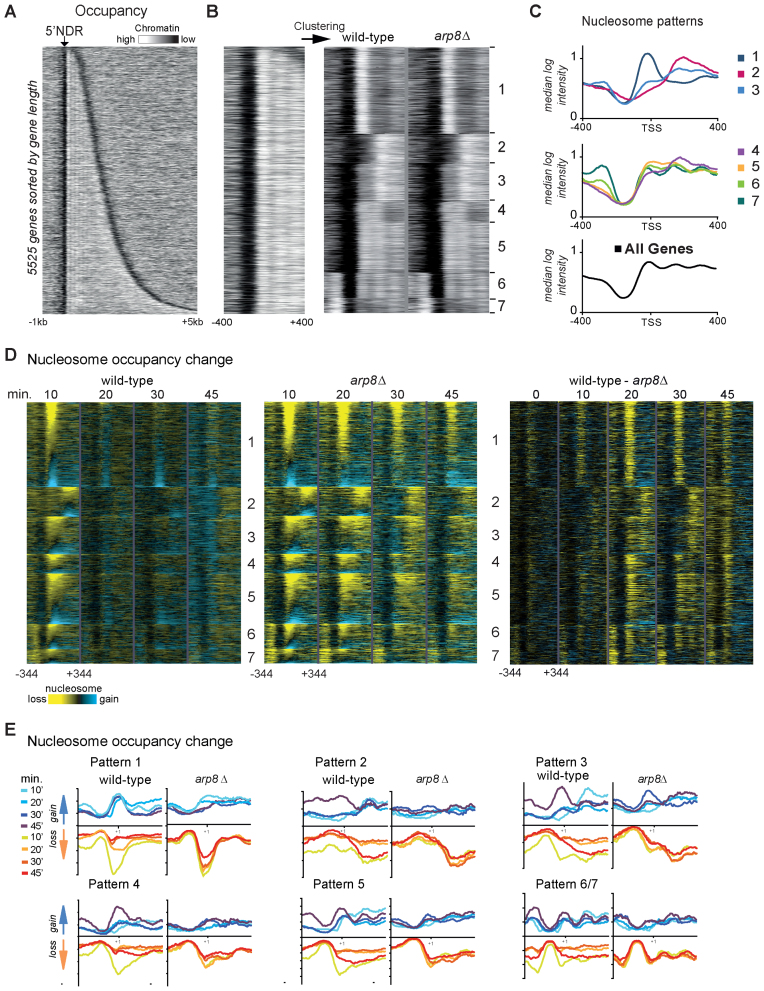
Figure 1.
INO80 alleviates osmotic stress induced chromatin remodeling. (A) Nucleosome occupancy map in wild-type cells of 5525 genes sorted by their ORF length. Each row represents 1 kb upstream and 5 kb downstream of the TSS. Data are derived from 8 bp tiling array data of MNase digested chromatin. (white: high nucleosome occupancy; black: low nucleosome occupancy). The heat map shows the typical pattern of nucleosome depleted regions flanked by positioned nucleosomes. (B) Seven different promoter chromatin patterns resulting from k-means clustering of nucleosome occupancy around the 5΄ NDR (−400 to +400 bp of the 5΄ border of +1 nucleosome) are shown. The arp8Δ mutant has a very similar pattern. Heatmaps were generated with identical settings. (C) Graphical illustration of the median nucleosome intensity of the respective promoter chromatin patterns shown in (B). (D) Nucleosome loss during hyperosmotic stress is more persistent in arp8Δ. Changes of nucleosome occupancy (reduction yellow, gain blue) in wild-type and arp8Δ (left and middle panel) are shown as difference between treated and untreated at the respective time points. The differences between wild-type and arp8Δ at every time point are also shown (right panel). Genes were ranked within the groups according to the change of the nucleosome intensity at the 10 min time point of the wild-type and adjusted to the position of the +1 nucleosome. (E) Graphs of nucleosome occupancy change (15th and 85th percentile) of patterns 1–6 show the persistence of nucleosome loss in the arp8Δ mutant.

