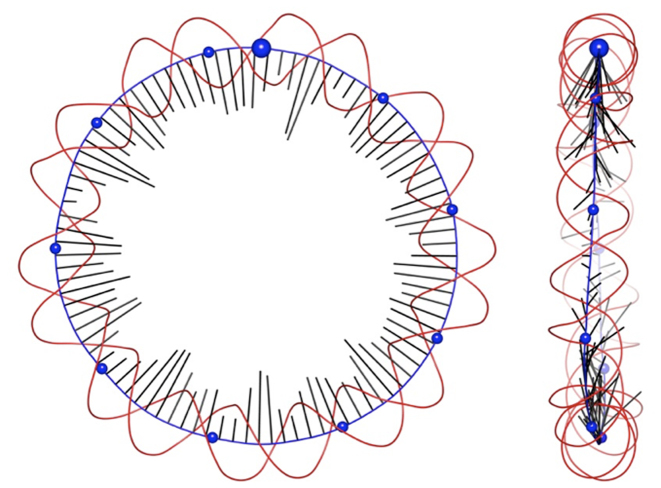
Figure 2.
Two orthogonal views of data derived from a Curves+ analysis of the average conformation of the RE_94 minicircle, showing the helical axis (blue), phosphodiester backbones spline curves (red) and curvature vectors (black) for each base pair step indicating the direction and the magnitude of curvature. Blue spheres are placed on the helical axis every 10 bp, starting at base pair step 1 (larger sphere) and increasing in a clockwise sense.

