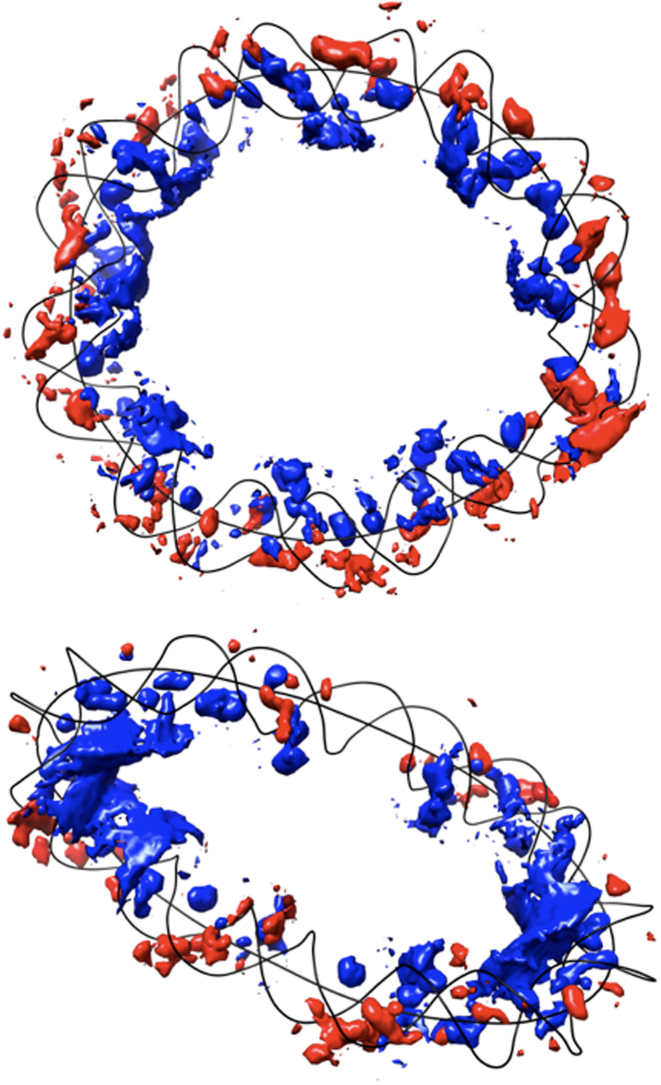
Figure 8.
Isomolarity surfaces at 2 M for potassium ions surrounding the UN_94 (top) and OV_89 (bottom). Blue: ion density inside. Red: ion density outside. For clarity, the minicircles are represented only by their helical axis and backbone spline curves (black lines). Base pair number 1 is at the top of each image and numbering increases in a clockwise sense.

