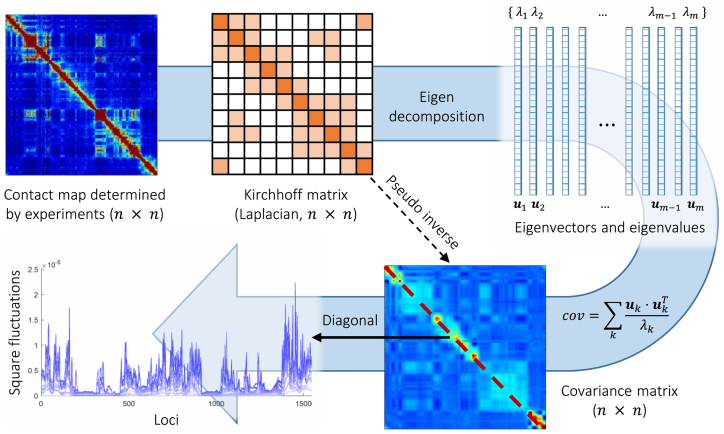
Figure 1.
Schematic description of GNM methodology applied to Hi-C data. The inter-loci contact data represented by the Hi-C map (upper left, for  genomic bins (loci)) is used to construct the GNM Kirchhoff matrix,
  (top, middle). Eigenvalue decomposition of
  yields a series of eigenmodes which are used for computing the covariance matrix (lower, right), the diagonal elements of which reflect the mobility profile of the loci (bottom, left), and the off-diagonal elements provide information on locus-locus spatial cross-correlations.
  ,
,  th eigenvector;
  ,
,  th eigenvalue;
  , number of nonzero modes, starting from the lowest-frequency mode, included in the GNM analysis (
 ). In the present application to the chromosomes,
  varies in the range
  , the lower and upper limits corresponding respectively to chromosomes 22 and 1.

