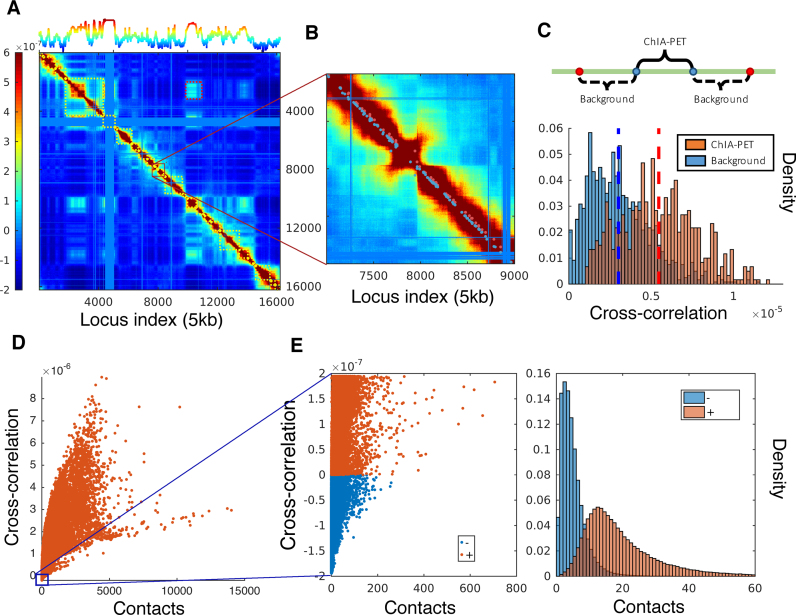
Figure 4.
Covariance map computed for chromosome 17 and comparison with ChIA-PET data and contacts from Hi-C experiments in GM12878. (A) Covariance matrix computed for chromosome 17, color-coded by the strength and type of cross-correlation between loci pairs ranged from 5th to 95th percentile of all cross-correlation values (see the color bar on the left). The curve on the upper abscissa shows the average overall off-diagonal elements in each column, which provides a metric of the coupling of individual loci to all others. The blocks along the diagonal indicate loci clusters of different sizes that form strongly coupled clusters. The red dashed boxes indicate the pairs of regions exhibiting weak correlations despite genomic distances of several megabases. The blue bands correspond to the centromere, where there are no mapped interactions. (B) Close-up view of a region along the diagonal. Red dots near the diagonal indicate pairs (separated by ∼100 kb) identified by ChIA-PET to interact with each other; nearby blue points are control/background pairs. (C) Stronger cross-correlations of ChIA-PET pairs compared to the background pairs. (D) Dependence of cross-correlations on the number of contacts observed in Hi-C experiments. A broad distribution is observed, indicating the effect of the overall network topology (beyond local contacts) on the observed cross-correlations. (E) Loci pairs exhibiting anti-correlated (same direction, opposite sense) movements usually have fewer contacts, compared to those exhibiting correlated (same direction, same sense) pairs of the same strength.

