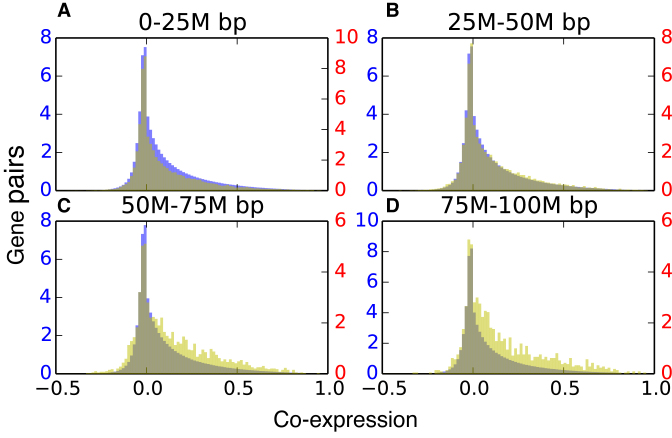
Figure 5.
Co-expression is significantly enriched in distant CCDDs. In each histogram, the yellow distribution represents gene pairs from CCDDs and the blue distribution represents background gene pairs. All are showing the normalized number of gene pairs with a particular Pearson expression correlation for gene pairs within a distance of (A) 0–25 million base pairs, (B) 25–50 million base pairs, (C) 50–75 million base pairs and (D) 75–100 million base pairs. The more distant pairs (50–100 million base pairs apart) within the CCDDs show enriched expression correlations as compared to the background pairs. There were not enough gene pairs within CCDDs more than 100M base pairs apart to draw significant conclusions.

