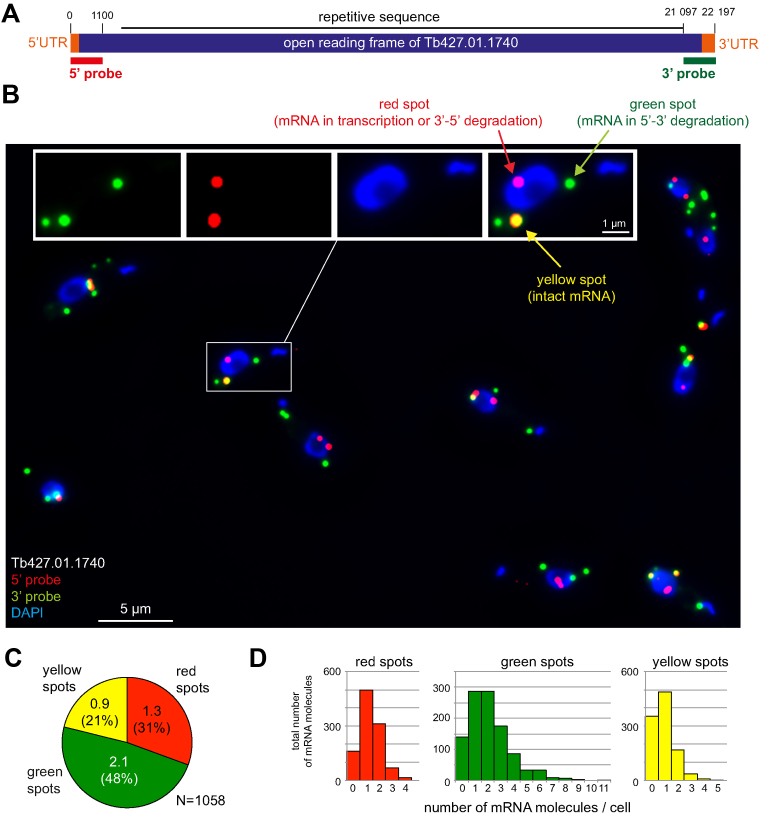
Figure 1.
A long mRNA as a reporter for mRNA metabolism. (A) Schematic of the mRNA metabolism reporter mRNA Tb427.01.1740. The 5΄ and 3΄ untranslated regions (UTRs) (orange) and the open reading frame (purple) are shown above the probes used for the detection of the 5΄ end (5΄ probe, red) or 3΄ end (3΄ probe, green). All elements are shown to scale. (B) Sample Z-stack projection image of trypanosome cells probed with both the 5΄ and the 3΄ probes and stained with DAPI. A merged image of all three fluorescence channels is shown; one cell is shown enlarged in separate channels in the inset. In trypanosomes, DAPI stains both the nucleus (large blue oval) and the kinetoplast (small blue spot or line), the mitochondrial genome. (C) Quantification of the different mRNA states. The number of red, green and yellow spots in each cell was counted. The values shown are average values of 1058 trypanosome cells from six independent experiments. Standard deviations are indicated. (D) Histogram displaying the distribution of the differently-coloured spots between individual cells. Data used are the same as in panel C.

