Figure 3.
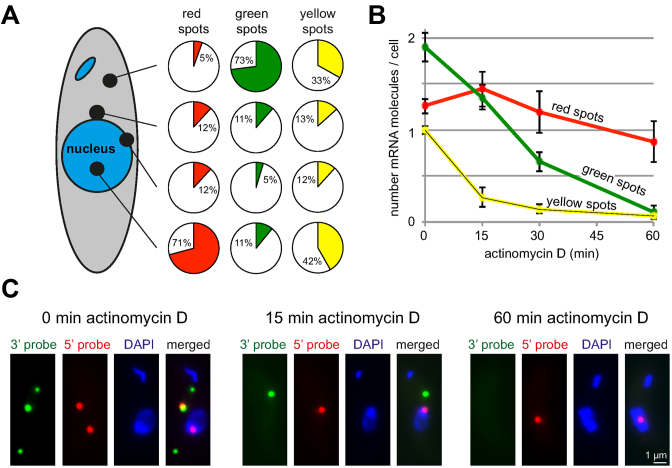
Subcellular localization and mRNA decay rates. (A) The red, green and yellow spots of 371 cells were classified according to their subcellular localization relative to the DAPI stained nucleus. For each colour, the fraction at each position is indicated in a pie diagram. (B) Cells were treated with actinomycin D (10 μg/ml) over a time-course of 60 min and probed with the 5΄ and 3΄ probes for Tb427.01.1740. Red, green and yellow spots were counted at the times indicated. Averages of the average values from three independent experiments are shown; in each experiment between 160 and 200 cells were analysed per time-point. Error bars represent the standard deviation between the three different experiments. (C) Z-stack projection image of a single representative cell probed with the 5΄ and 3΄ probes of Tb427.01.1740 after 0, 15 and 60 min actinomycin D treatment. More cells are shown in Supplementary Figure S4.

