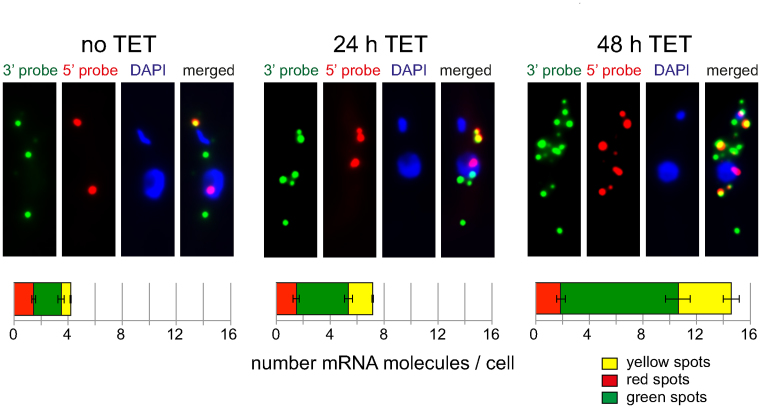
Figure 5.
Inducible RNAi depletion of XRNA. Tetracycline inducible RNAi depletion of XRNA was done as previously described (24). Cells induced for RNAi depletion of XRNA for 0, 24 or 48 h were probed with the 5΄ and 3΄ probes specific for Tb427.01.1740. Z-stack projections of representative cells are shown for each time-point; more cells are shown in Supplementary Figure S6. Red, green and yellow spots were counted. Averages of the average values of three independent clonal cell lines are shown; for each clone, between 100 and 200 cells were analysed for each time-point. Error bars represent the standard deviation between the three different clones.

