Figure 6.
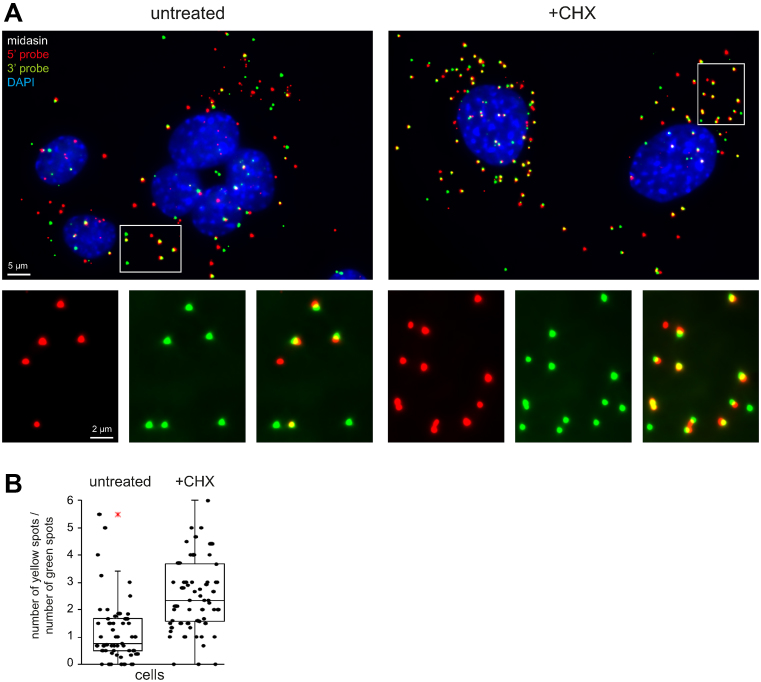
Detection of mRNA decay intermediates in mammalian cells. NIH3T3 cells were treated with 5 μM cycloheximide for 60 min and simultaneously probed with probes specific to the 5΄ end (red) or 3΄ end (green) of midasin mRNA. The DNA was stained with DAPI. (A) Z-stack projection images of untreated cells and cells treated with cycloheximide. A merged image of all three fluorescence channels is shown; a section is shown enlarged in separate channels in the inset. (B) The number of green and yellow spots in the cytoplasm of each cell was quantified from Z-stack projections and the ratio (yellow/green) is blotted for each cell. The cytoplasm was defined as the cellular space outside the nucleus, ignoring spots that lay on top or below the nucleus. A cell was defined as having one nucleus; in dividing cells, or when individual cells could not be clearly distinguished, the spots were counted together and then divided through the number of nuclei. The data are presented as box plots (waist is median; box is interquartile range (IQR); whiskers are ±1.5 IQR; only the smallest and largest outliers are shown; n ≥ 73). These are representative data from one of two independent experiments.

