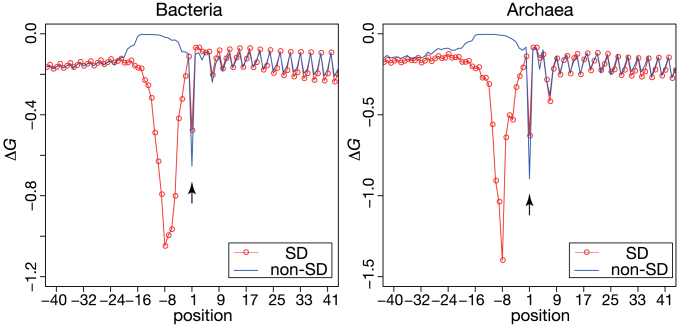
Figure 3.
Average Gibbs energy changes of SD and non-SD genes in bacteria and archaea. The Gibbs energy changes, ΔG, of the interactions between the 3΄ tail of 16S rRNA and sequences around the initiation codons of mRNAs were calculated for both SD (red line with circle) and non-SD genes (blue line) in bacteria (left) and archaea (right). The decrease indicated by an arrow represents the position that includes the initiation codon. The upstream decreases near position 8 indicate the presence of SD sequences.

