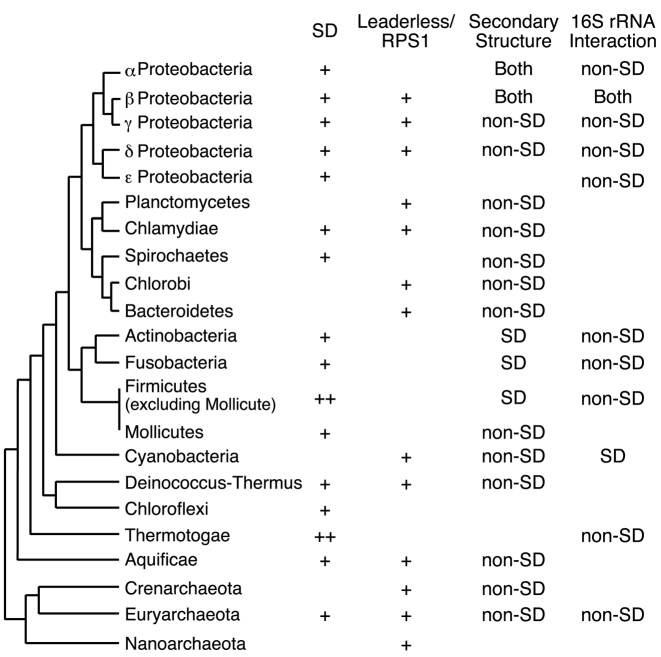
Figure 4.
Cladogram representing translation initiation mechanism usage in prokaryotes. This phylogenetic classification follows that of Olsen et al. (50). For the SD column, the average fraction of SD genes in a species for each phyla (RSD) was determined by Nakagawa et al. (6) and are presented as follows: ++, RSD > 0.8; +, RSD > 0.5. For the leaderless/RPS1 column, + indicates a positive mean value of the principal component (PC) 3 (shown in Table 1) in a taxonomic group of bacteria, or if positive PC 2 for a given phylum of archaea. Note that the RPS1 signal is functional only in bacteria. For the secondary structure column, ‘non-SD’ is indicated if a species exhibited a statistically weaker structure around the initiation codon for non-SD genes (P < 0.01 with the Bonferroni correction, Table 2); ‘SD’ indicates a species exhibiting the opposite trend. For 16S rRNA interaction column, ‘non-SD’ indicates a species that exhibited a statistically stronger interaction between the tails of 16S rRNA and 5΄ UTRs of mRNAs from non-SD genes (P < 0.01 with the Bonferroni correction, Table 2); ‘SD’ indicates which species of Cyanobacteria exhibited the opposite trend.

