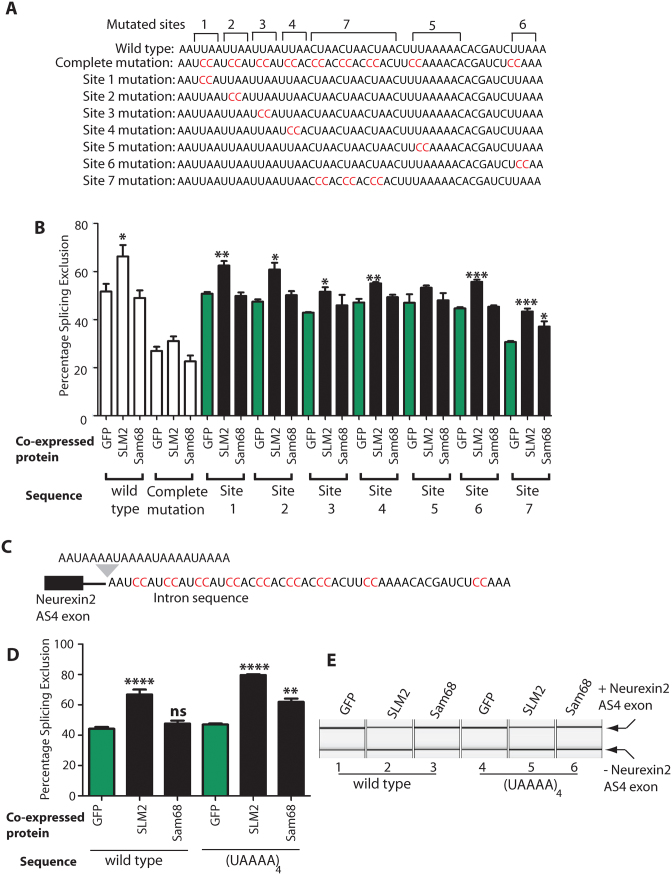
Figure 6.
Dissection of the 51 nucleotide SLM2 response element downstream of the Neurexin2 AS4 exon. (A) Sequence repeat composition of the 51 nucleotide cluster of Sam68/SLM2 binding sites downstream of the Neurexin2 AS4 exon (6), with the individual tested sequence elements in mutants 1–7 shown underneath. In each case, the mutated nucleotides are shown in red, and wild type nucleotides are black. (B) Effects on splicing exclusion of the Neurexin2 AS4 exon, after mutating individual components of this repeat sequence shown as a bar chart. (C) Minigene structure after the endogenous 51 nucleotide SLM2 response element is mutated, and a (UAAAA)4 sequence inserted immediately upstream of this mutated sequence. (D) Bar chart and (E) example capillary gel electrophoretogram showing splicing response of the Neurexin2 AS4 exon after the 51 nucleotide SLM2 response element is substituted with a (UAAAA)4 sequence. Data shown in all the bar charts are averages from at least three biological replicates, with splicing levels in cells transfected with GFP data shaded green and splicing levels in cells transfected with SAM68 and SLM2 shaded black. Statistical significance was addressed using t tests, and is indicated on the bar chart as ****P < 0.0001; ***P < 0.001; **P < 0.01; *P < 0.05. Error bars show standard error of the mean. Data previously shown in earlier panels is shown as white bars.

