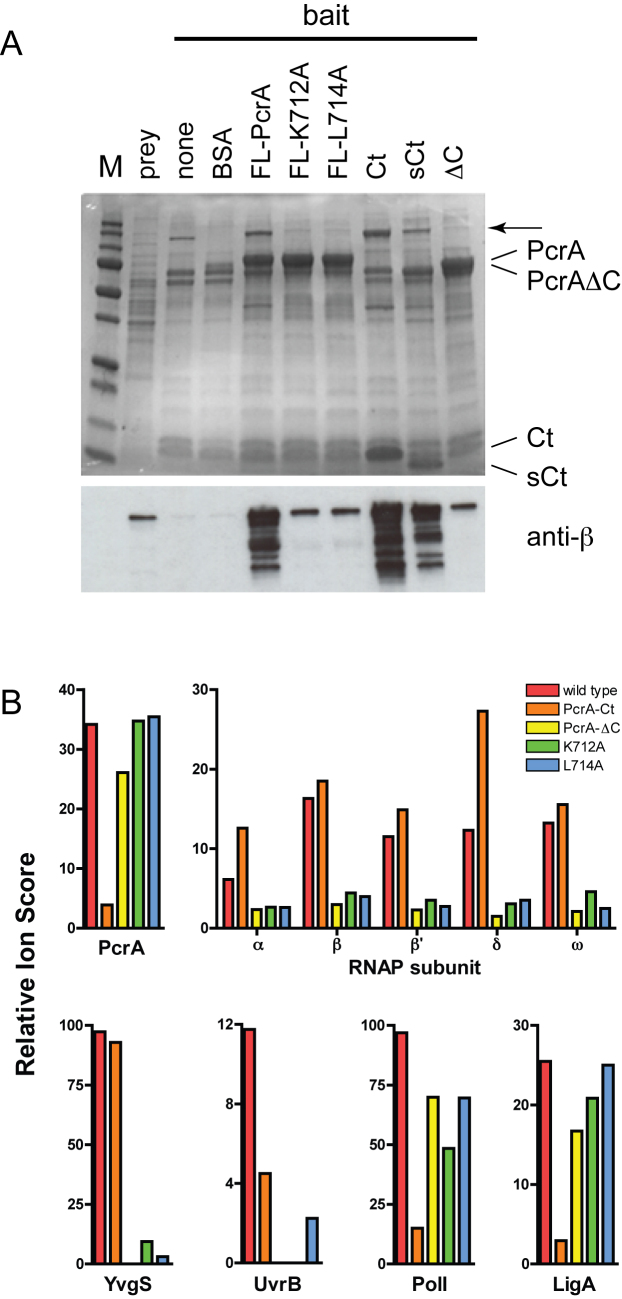
Figure 3.
Mutation of the PcrA CTD reduces binding to RNAP. (A) Affinity pulldown assays using the biotinylated proteins as bait and B. subtilis cell extract as prey. The upper panel shows an SDS-PAGE gel analysis of the cell extract following pulldown using baited magnetic beads. The arrow signifies the position of the β and β΄ subunits of RNAP. The lower panel shows analysis of the same gel using a monoclonal antibody against the β subunit of RNAP. Note that the K712A and L714A mutations were made in the context of full length (FL) PcrA. (B) Quantification of the pulldown experiments using mass spectrometry using the bait proteins indicated and a ‘no bait’ control as the reference. The Relative Ion Score value shown is the total ion score for the prey divided by the equivalent value in the control: a measure of relative abundance of the prey. The enrichment of PcrA in the pulldown samples reflects the presence of the bait protein and acts as an internal control. Selected results are shown for the subunits of RNAP and for several other proteins that are discussed in the text. Further and more detailed results are shown in Supplementary Table S1.

