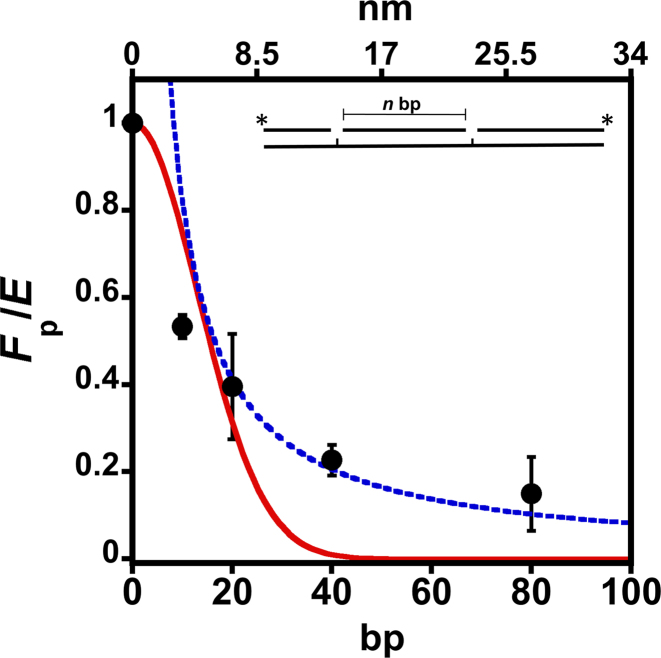
Figure 5.
Site-spacing dependence of Fp normalized by the insertion efficiency (E). The Fp was measured for processive substrates containing 10, 20, 40 and 80 bp spacing distances (bottom x-axis) at 150 mM ionic strength. The top x-axis represents the distance (nm) between the two 1-nt gaps. The mean and standard deviation from three independent experiments is shown. The Fp is normalized by the efficiency of insertion (Supplementary Figure S4). The red line represents the best fit to a sliding mechanism (Equation 5). The blue line is a fit to a hopping mechanism (Equation 6).

