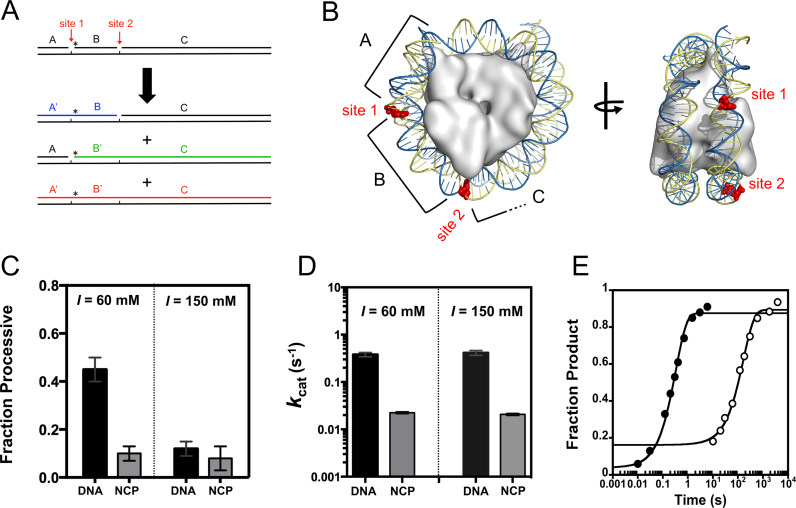
Figure 7.
Pol β catalyzed nucleotide insertion is reduced in the 601 NCP resulting in a lack of processivity. (A) NCP processive substrate design. Schematic depicting positions of 1-nt gaps and labeling strategy. Oligonucleotide B is 5΄ labeled with a 32P phosphate. Site one is located 15 nts and site two 32 nts from the 5΄ end. Reactions were performed as described in Figure 2A. (B) Crystal structure of the NCP containing 601 sequence (PDB: 3LZ0). The positions of the 1-nt gaps are shown as red spheres. (C) Bar graphs representing the fraction of processive Pol β molecules in DNA and NCP reactions at 60 mM and 150 mM ionic strength. The Fp values at 60 mM ionic strength are 0.46 ± 0.05 and 0.1 ± 0.03 for DNA and NCP, respectively. The Fp values at 150 mM ionic strength are 0.12 ± 0.03 and 0.08 ± 0.05 for DNA and NCP, respectively. The error bars report the mean and standard deviation from at least two measurements performed with two independent NCP preparations. (D) Bar graph representing the kcat (for total product formation) for DNA and NCP at 60 and 150 mM ionic strength. The kcat values at 60 mM ionic strength are 0.38 ± 0.07 s−1 and 0.02 ± 0.002 s−1 for DNA and NCP, respectively. The kcat values at 150 mM ionic strength are 0.41 ± 0.09 s−1 and 0.02 ± 0.002 s−1 for DNA and NCP, respectively. The error bars report the mean and standard deviation from at least two measurements performed with two independent NCP preparations. (E) Single-turnover time-courses for Pol β catalyzed nucleotide insertion at site two. Reaction conditions include 2 μM Pol β with 50 nM DNA (closed) and NCP (open), 150 mM ionic strength, 50 μM dGTP, and standard reaction conditions. The non-zero y-intercept for the NCP time-course is proposed to be a result of the NCP preparation containing a fraction of free DNA or a population of NCP that reacts before the major phase. The data are fit to a single-exponential equation yielding kobs values of 3.0 ± 0.2 s−1 and 0.006 ± 0.001 s−1 for DNA and NCP, respectively.

