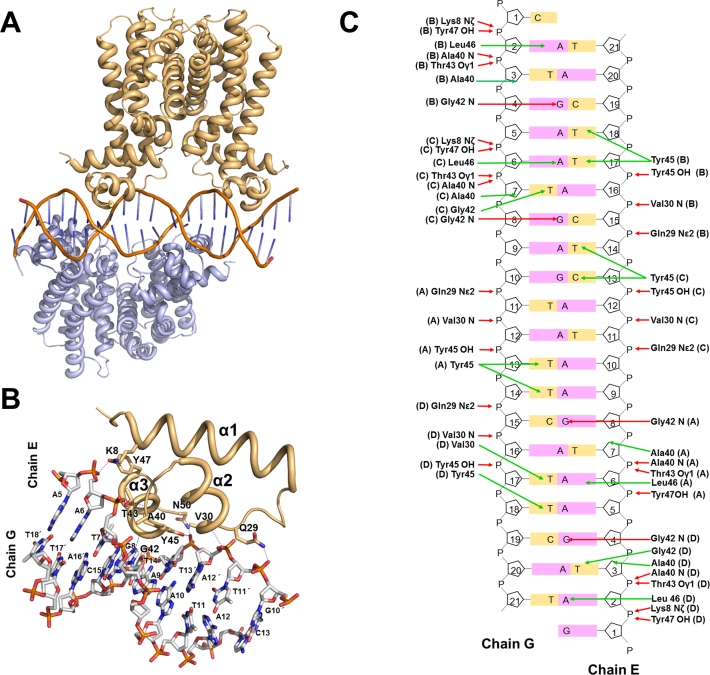
Figure 3.
Crystal structure of Bacillus halodurans FadR in complex with fadR promoter. (A) Cartoon representation of the FadR:DNA complex formed by a dimer of dimers (gold and teal) and a DNA molecule (orange). (B) Close-up view of the B. halodurans FadR–DNA interface within the monomer. The hydrogen bond interactions are drawn as blue dash lines. The DNA bases are listed, and prime indicates complementary strand of chain E. The figure has slightly different orientations from figure (A) in order to show the detailed interactions better. (C) Detailed schematic representation of FadR–DNA interactions. Residues involved in DNA interactions are shown, and each subunit is marked in parenthesis. Red and green arrows indicate hydrogen bonds and hydrophobic interactions, respectively.

