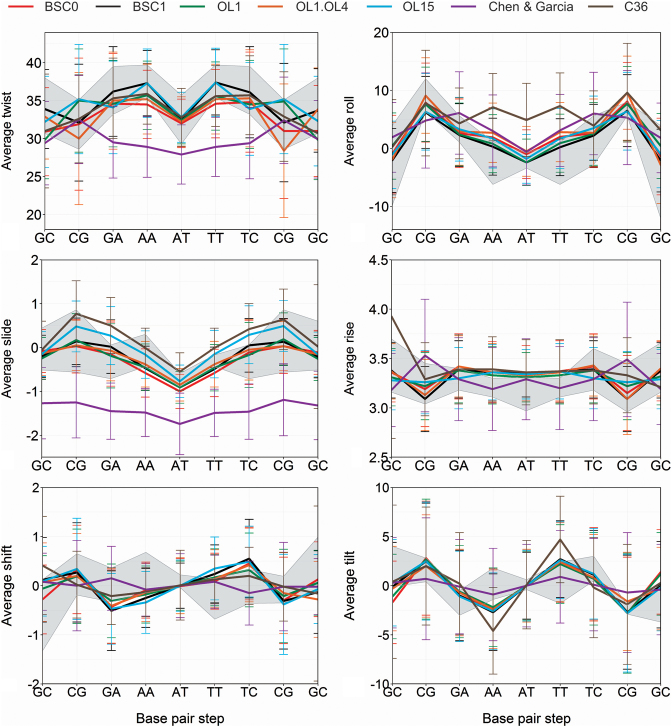
Figure 2.
Averages and standard deviations of the 6 base-pair step helical parameters of DDD. All the tested force-field are compared with an experimental range (gray zone defined by the average ± standard deviation) obtained by taking the NMR structures 1NAJ, Standard (in-house data) and the X-ray structures with PDB codes: 1BNA, 2BNA, 7BNA, 9BNA, 1JGR and 4C64. The C36polforce-field leads to corruption of the helix for μs-scale simulation and results are not shown. See Figure 3 for structural models.

