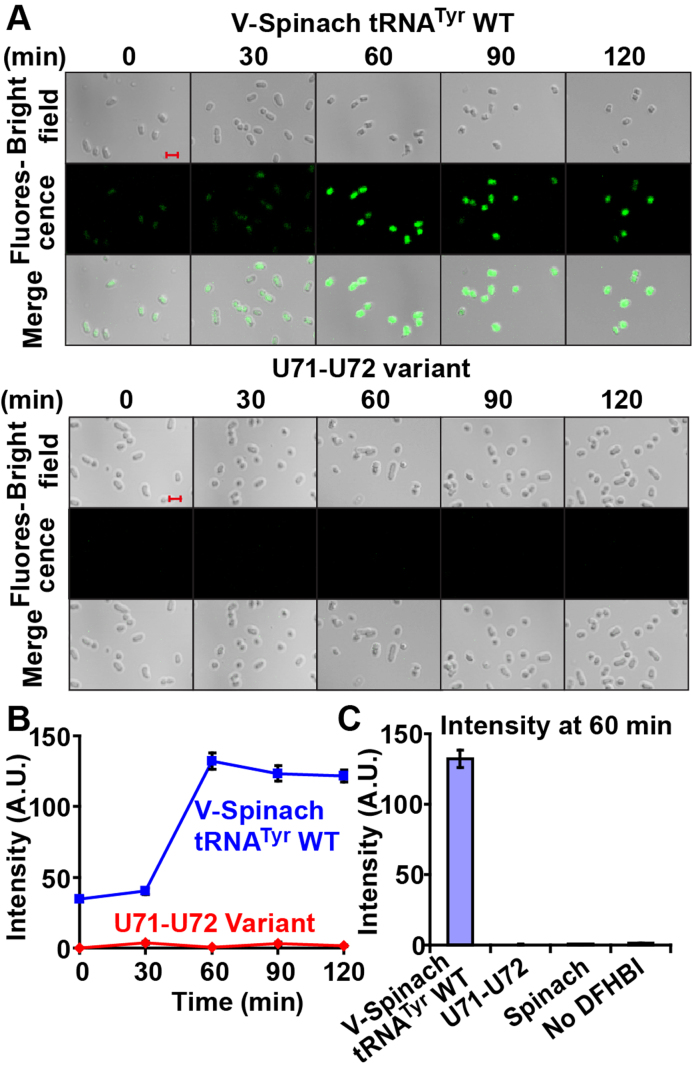
Figure 2.
Live-cell imaging of the amber-suppressor form of V-Spinach tRNATyr /CUA in E. coli. (A) Fluorescence microscope images of E. coli cells expressing the amber suppressor form of V-Spinach tRNATyr, WT (top) or U71-U72 variant (bottom). The Spinach tRNA fusion was constitutively expressed in CA244 cells. Upon entering log-phase, an aliquot of cells was harvested, washed, suspended in M9 minimal medium and immobilized on a poly-(D)-lysine-coated glass slide. Cells were incubated with DFHBI for 5 min, and washed off the excess ligand. The diffusion of bound DFHBI from cells was limited in the immobilized condition and in minimal media. Green fluorescence was excited by 488 nm Argon ion laser and monitored under a microscope over a time course at a constant temperature of 22.5°C. DIC images and scale bars (each representing 2 μm) are shown. Few cell-to-cell variations are seen in the green channel. (B) Quantification of the time courses of fluorescence intensity. Average intensity of the pixels corresponding to the area of a single E. coli cell was quantified by image analysis software (see methods for details). Error bars are expressed as standard errors of mean (SEM), n = 100 for each of the time points. (C) The average fluorescence intensity of the native and the U71-U72 variant of V-Spinach tRNATyr at 60 min compared to negative controls, where only the Spinach stand-alone was expressed (‘Spinach’) or where V-Spinach tRNATyr/CUA was expressed in the absence of DFHBI (‘No DFHBI’). Error bars are expressed as SEM, n = 100 for each of the time points.

