Figure 1.
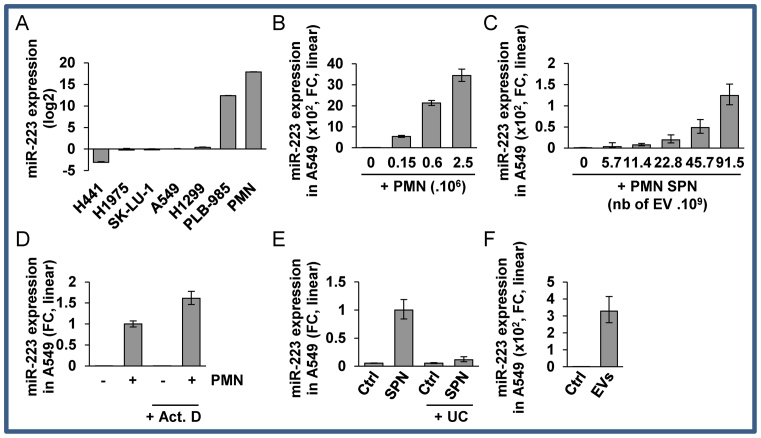
Ex-miR-223-3p is engulfed into recipient cells (A) Relative quantification analysis of ex-miRNA-223-3p expression in H441, H1975, SK-LU-1, A549, H1299, PLB-985 and PMN cells. Cell lines were harvested at 70% confluency. PMN were isolated from blood as described in the ‘Materials and Methods’ section. (B) Relative quantification of the expression of ex-miR-223-3p in A549 cells after overnight co-culture with increasing numbers of PMN and extensive washes. (C) Relative quantification of the expression of ex-miR-223-3p in A549 cells following incubation with increasing amounts of SPN. (D) Relative quantification of the expression of ex-miR-223-3p in A549 cells following incubation with SPN or SPN depleted of EVs by ultra-centrifugation (UC). (E) Relative quantification of the expression of ex-miR-223-3p in A549 cells incubated overnight with EVs isolated from SPN of PLB-985 cells. (F) Relative quantification of the expression of ex-miR-223-3p in A549 cells co-cultured overnight with PMN and treated with actinomycin D (Act. D) at 10 μg/ml. Cells were extensively washed and harvested. (A–E) For all experiments, the levels of miR-223-3p were normalized using U6 snRNA. (F) Spike-in were used for normalization (see the ‘Materials and Methods’ section). (A–F) Results are representative of three biological replicates, ‘centre values’ as mean and error bars as s.d.

