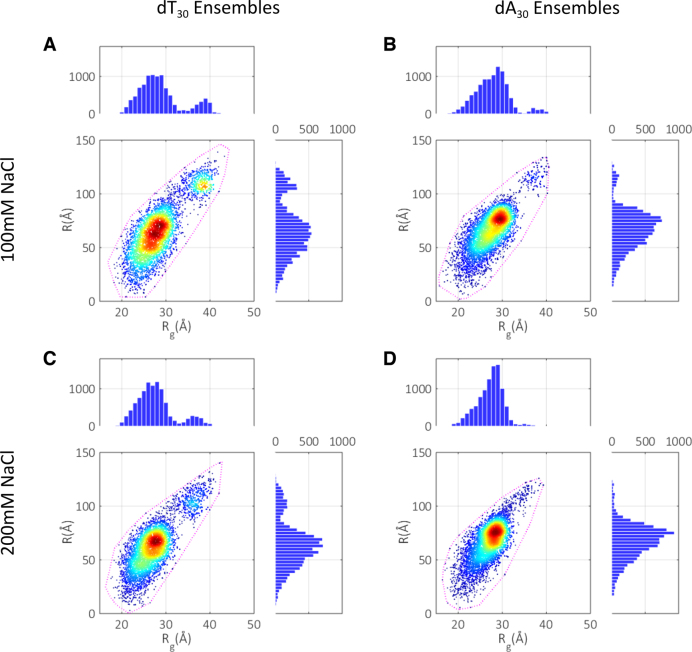
Figure 3.
Conformation spaces selected in the final round of ensemble optimization. (A) dT30 at 100 mM NaCl. (B) dA30 at 100 mM NaCl. (C) dT30 at 200 mM NaCl. (D) dA30 at 200 mM NaCl. The bounding contour of the fully refined pools (the outline of Figure 2B for each experimental condition) are indicated by the dashed lines. The selected distributions are also projected onto the R and Rg axes, and visualized as histograms. Mean values and standard deviations of the projected distributions are given in Table 1.

