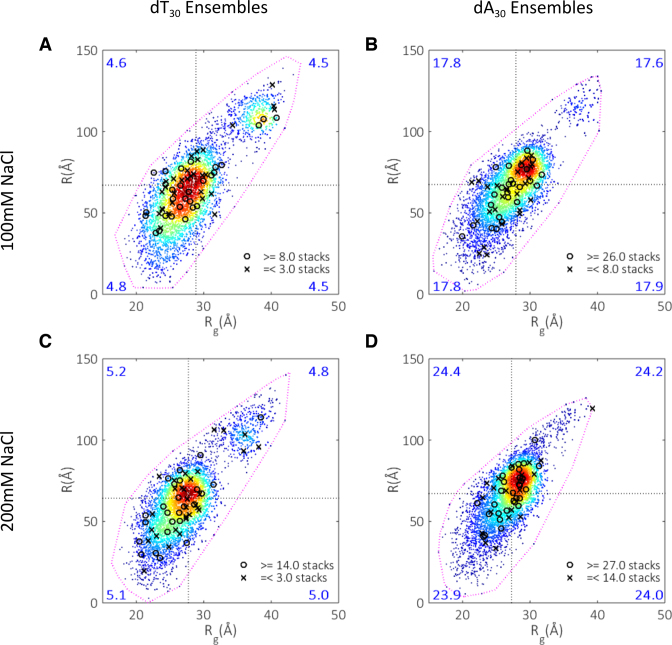
Figure 5.
Stacking maps. Each space is divided into four quadrants, with the divisions marked by the mean Rg and R for each ensemble. The mean number of stacked bases per structure is calculated for each quadrant and displayed in the relevant corners (large numbers). Extreme examples of stacked structures are located by circles (highly stacked) and crosses (least stacked). The specific number of stacked bases defining these extreme structures is shown in the legend accompanying each panel. (A) dT30 at 100 mM NaCl. (B) dA30 at 100 mM NaCl. (C) dT30 at 200 mM NaCl. (D) dA30 at 200 mM NaCl.

