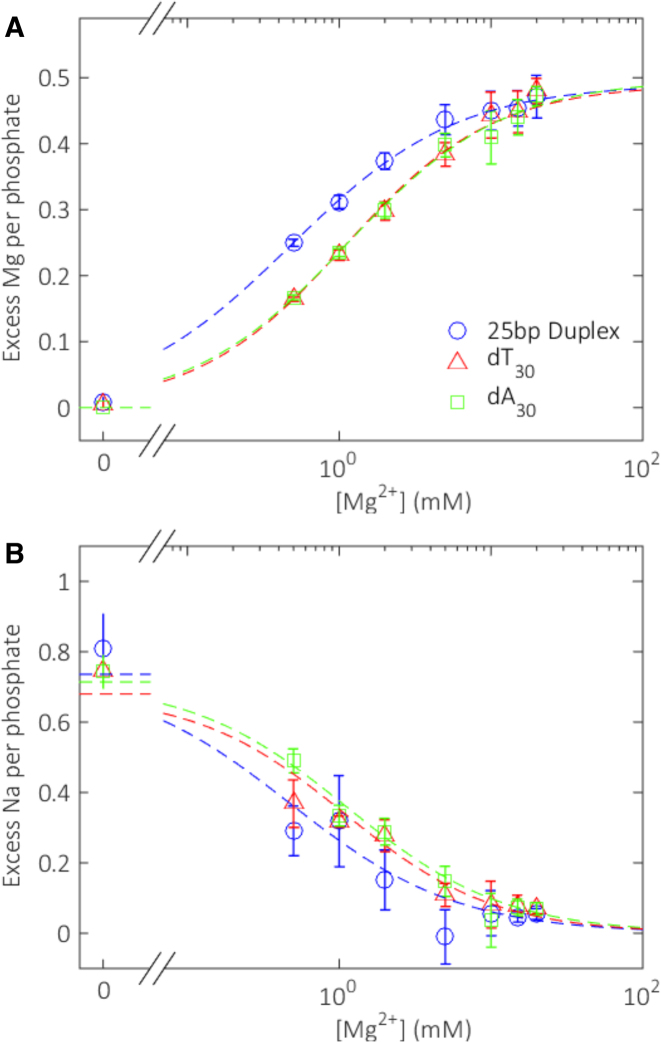
Figure 6.
Ion counting results. (A) Number of excess magnesium ions and (B) sodium ions per phosphate attracted to three different constructs as a function of magnesium ion concentration. Dashed lines show Hill-equation fits to the data points, as described in the ‘Materials and Methods’ section. Fit parameters are given in Supplementary Table S1.

