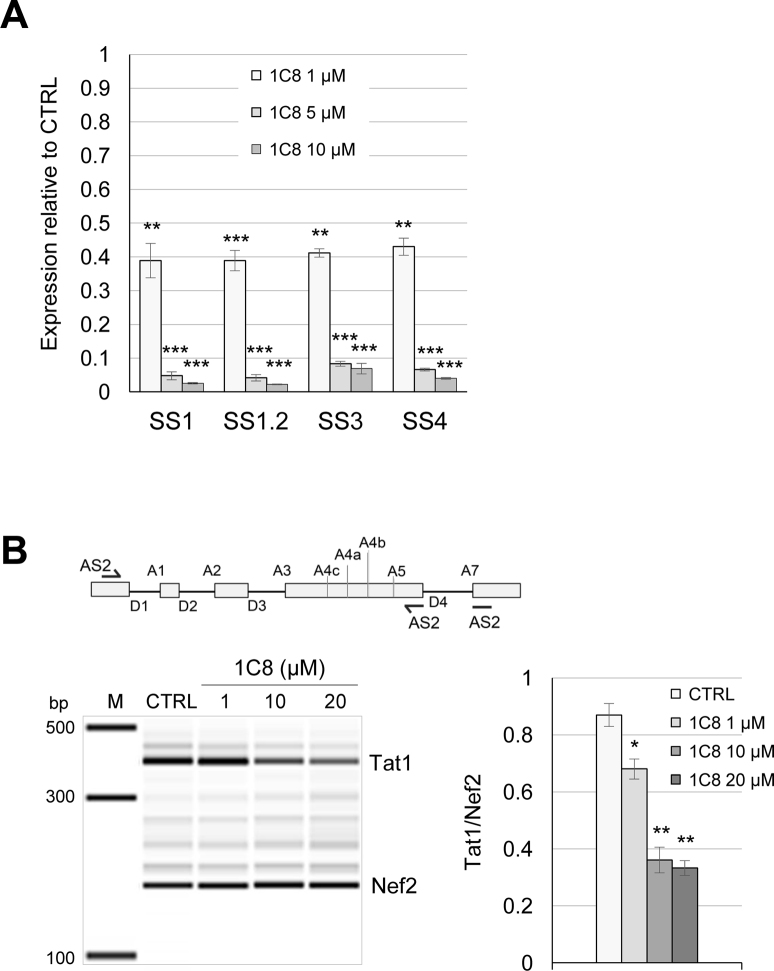
Figure 2.
Effect of 1C8 on HIV-1 splicing. (A) Quantitative RT-PCR assays from HeLa-HIV cells treated with 1C8. Histograms depicting the impact of 1C8 on selected amplicons produced with the primers indicated in Figure 1A. The intensity of products was normalized relative to the amount produced in the controls (which corresponds to an arbitrary unit value of 1). (B) Map of donor and acceptor splice sites (5΄ss and 3΄ss, respectively) used for the production of the major HIV-1 mRNAs. The AS2 set of primers was used to monitor the production of Tat1 and Nef2. Endpoint RT-PCR assay from HeLa-HIV cells treated with 1C8. Representative electropherograms showing the Tat1 (D1/A3) and Nef2 (D1/A5) amplicons. Histograms depicting the impact of 1C8 on Tat1 and Nef2 production. In both panels, asterisks represent significant P values (two-tailed Student's t test) comparing the means between 1C8-treated samples and their respective controls; *P < 0.05, **P < 0.01 and ***P < 0.001.

