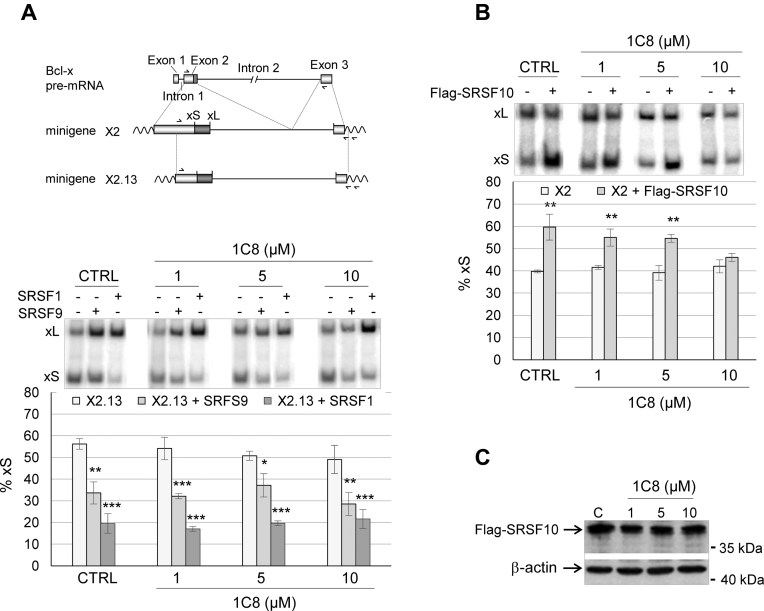
Figure 4.
Impact of 1C8 on the activity of SRSF1, SRSF9 and SRSF10. (A) 293 cells were co-transfected with a plasmid carrying Bcl-x minigene X2.13 and a plasmid containing the CMV promoter driving the expression of the SRSF1 or SRSF9 cDNA, as described previously in Cloutier et al. (30). The assay was performed in the presence of the indicated concentrations of 1C8. A map of the Bcl-x gene is shown on top to illustrate portions used to create minigenes X2.13 and X2 (see panel B). The position of the 5΄ splice of Bcl-xS (xS) and Bcl-xL (xL) is shown as well as the position of primers used in the RT-PCR assays. (B) 293 cells were co-transfected with the Bcl-x minigene X2 and a Flag-SRSF10 plasmid in the presence of the indicated concentrations of 1C8. The percentage of Bcl-xS over the sum of both Bcl-xS and Bcl-xL is shown in histograms. (C) Immunoblot performed to monitor the expression of Flag-SRSF10. In all cases, asterisks represent significant P values (two-tailed Student's t test) when comparing the means between samples and their respective controls; *P < 0.05, **P < 0.01 and ***P < 0.001.

