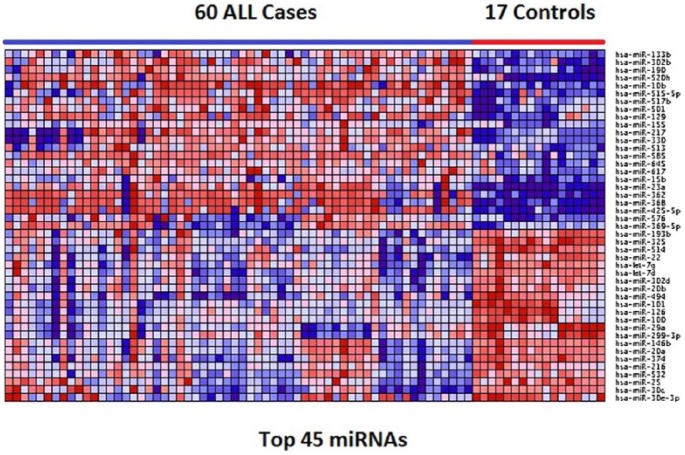
Figure 2.
Patterns of expression profiles for the top 45 most highly significantly (P < 10−5) differentially expressed miRNAs distinguishing pediatric patients from control samples. The pediatric patients and controls are represented in columns and the miRNAs are represented in the rows. The color red and blue in the heat map indicate upregulation and downregulation, respectively. ALL indicates acute lymphoblastic leukemia; miRNA, microRNA.

