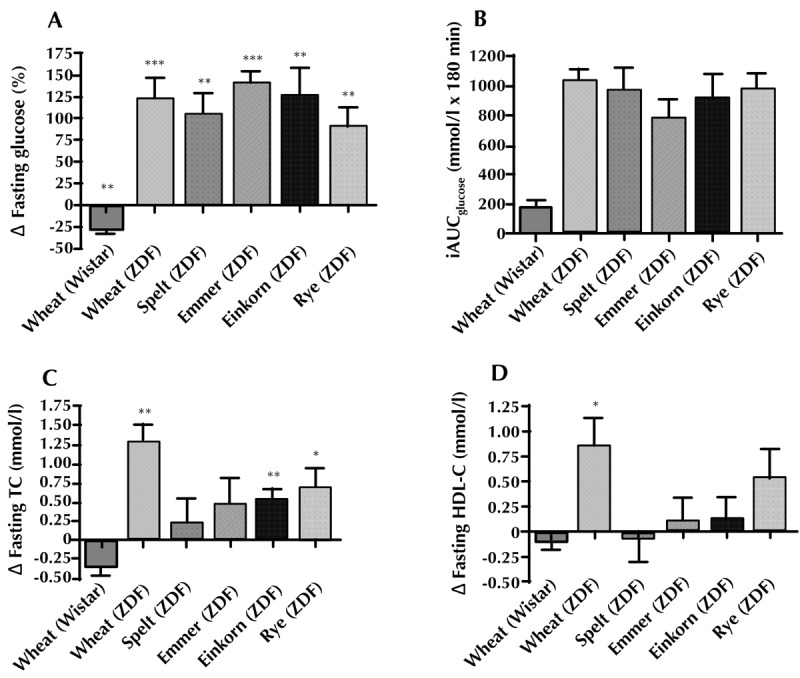
Figure 1.

Percentage changes (Δ) in fasting glucose differences (A), area under the glucose response curve (iAUCglucose) during an oral glucose tolerance test (B), changes (Δ) in fasting plasma concentration of total cholesterol (C), and HDL-cholesterol (D). Data are presented as mean (± SEM). All statistical calculations are within-group differences. * p < 0.05, **p < 0.01, ***p < 0.001. Abbreviations: HDL-C – high-density lipoprotein cholesterol, iAUC – incremental area under the curve, TC – total cholesterol, ZDF – Zucker diabetes fatty.
