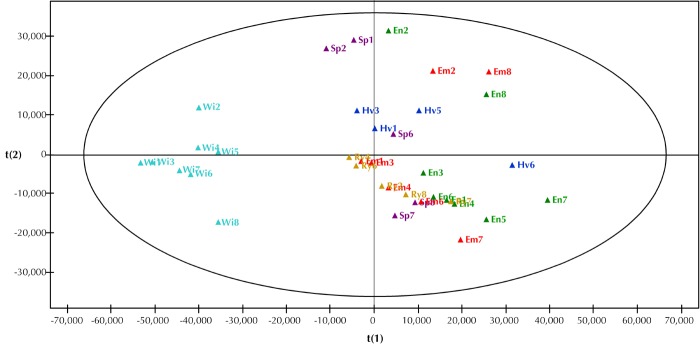
Figure 3. Score scatter plot based on 1H NMR spectra of plasma samples from the 6 different groups.
The plots represent the results for emmer (Em, red), einkorn (En, green), wheat (Hv, blue), rye (Ry, brown), spelt (Sp, purple), and Wistar (Wi, turquois). The spectrum regions (variables) responsible for the discrimination of diabetic rats from normal rats are lower levels of lactate and choline combined with elevated levels of VLDL/LDL, lipids, amino acids, and glucose. Component 1 (x-axis) 49.76% and component 2 (y-axis) 14.16%.

