
Figure 1.
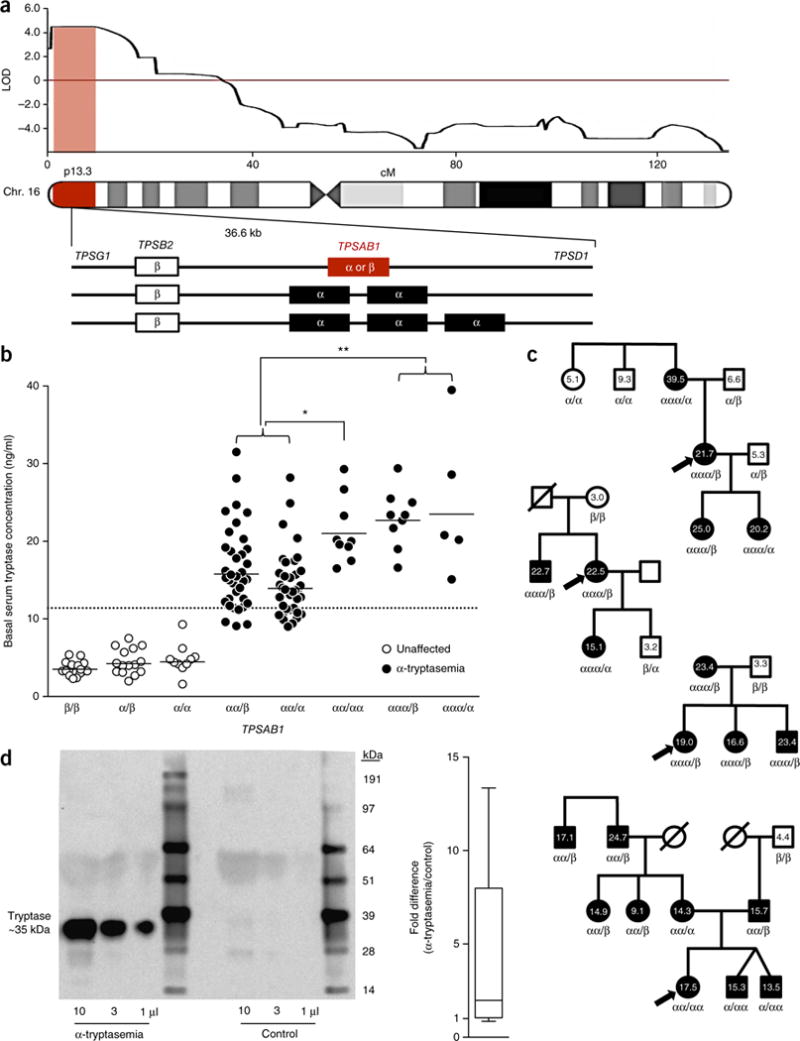
Inherited duplications and triplications of the α-tryptase–encoding sequence in the TPSAB1 gene are associated with elevated basal serum tryptase levels and enhanced mast cell secretion of tryptase. (a) Top, linkage analysis of exome sequence data from eight families showing the single linkage region on chromosome 16p13.3 (556,104–5,653,182, GRCh37/hg19) (LOD = 4.46). Middle, the 36.6-kb tryptase locus present within this region contains four tryptase-encoding genes: TPSG1, TPSB2, TPSAB1, and TPSD1. TPSB2 and TPSAB1 can both encode β-tryptase, but only TPSAB1 encodes α-tryptase. Individuals with inherited elevated basal serum tryptase levels had duplication or triplication on single alleles of the α-tryptase–encoding sequence in TPSAB1; schematics of how this genetic change may manifest are shown at the bottom. (b) Basal serum tryptase levels and corresponding TPSAB1 tryptase genotypes (where α represents one copy of α-tryptase and β represents one copy of β-tryptase) among families (n = 35) identified with hereditary α-tryptasemia syndrome. The upper limit of normal, as defined by multiple clinical laboratories (>11.4 ng/ml), is indicated by the dashed line. Data are shown as geometric means; *P = 0.0012, **P < 0.0001, Mann–Whitney test. (c) Sample pedigrees from four families with hereditary α-tryptasemia syndrome; numbers indicate basal serum tryptase concentration (in ng/ml). (d) Left, immunoblot of culture medium (10, 3, or 1 μl) from one of five paired mast cell cultures derived from the peripheral CD34+ cells of individuals with single-allele duplication or triplication of α-tryptase–encoding sequence in TPSAB1 (α-tryptasemia) or controls. Right, fold increase in the total tryptase content of α-tryptasemic supernatants (n = 5) shown relative to supernatants from paired controls (n = 5) for five independent mast cell culture experiments. Each box shows the median, 25th percentile, and 75th percentile, and whiskers extend to minimum and maximum values.