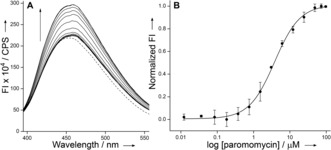
Figure 3.

A) Emission spectra (solid lines) of A‐site RNA 3⋅4 as a function of increasing concentration of paromomycin. The dashed line represents an emission profile in the absence of aminoglycoside. B) Curve fitted for the titration of A‐site with paromomycin. Normalized fluorescence intensity (FI) at λ em=450 nm is plotted against log[aminoglycoside].
